How to pass Sisense user id to the SQL Queries in Live Model
Hi - We have a requirement to access Sisense User Id in the Live model SQL Queries. Do we have any way we can access the Sisense User Id/ Group via some variables?
Hi - We have a requirement to access Sisense User Id in the Live model SQL Queries. Do we have any way we can access the Sisense User Id/ Group via some variables?
Hi, Can I manipulate card view for individual widgets and also easily make changes to set the card view type border only for certain sides of the (Top, Bottom, Left, Right) widget? Thanks
I have a dashboard with three filter buttons made from BloX that will filter the dashboard for specific time ranges (last 2 weeks, last 4 weeks, last 8 weeks). These buttons work as expected by creating a custom filter when there is no option that ma...
Hi Sisense Community! I would like to write a script to remove the first row of the pivot table in my widget. I don't want to use an advanced filter, as I already tried that and using a filter affects the rest of the values since I use a DIFFPASTWEEK...
Hi! I am creating a pivot table and I currently have all the values populated until the end of this year. However, I would only like to include values up until the previous week, which is a dynamic date. Is there an advanced filter I could use that w...
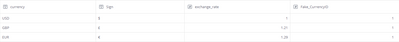
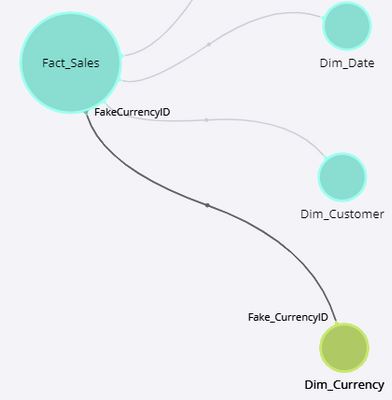
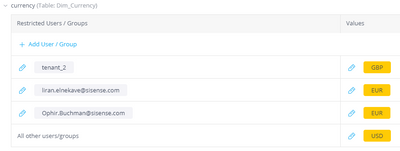
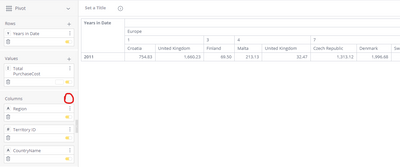
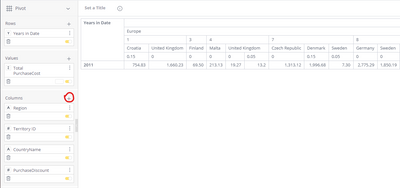
Introduction The following article answers a use case where each user/group in your organization should see their data in a different format. This logic can be applied to various measurements: Currency (USD/NIS/EUR/etc.)Distance (KM/Mile)Temperature ...

When sharing a dashboard you might want to prevent the user from seeing the "Analyze It" buttons on the widget's title bar Add the following dashboard script: dashboard.on('widgetready', function(dash) { $('.analyze-it-button').remove()}) BeforeAf...
![83227784_3726975083979609_8570336295451099136_n[1].jpg](/t5/image/serverpage/image-id/602i3D789947CB5B424B/image-size/medium/is-moderation-mode/true?v=v2&px=400)
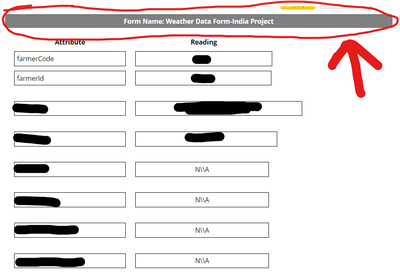
I want to make the iteration over the Form Name marked(in red) in the below image. So, basically here there is a header name which has some attributes and their corresponding values which is different for every header and also there are multiple such...
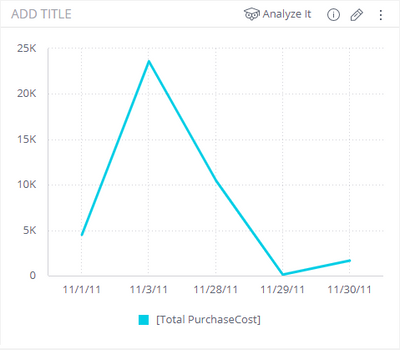
Hi! I have an indicator widget that is updated weekly to show the latest weekly values. As such, I would like to have a line underneath this number that says something like 'updated as of *latest week date*' . The date would have to be updated based ...
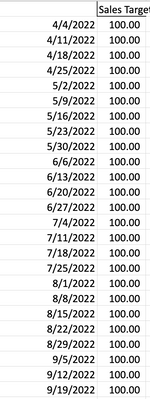
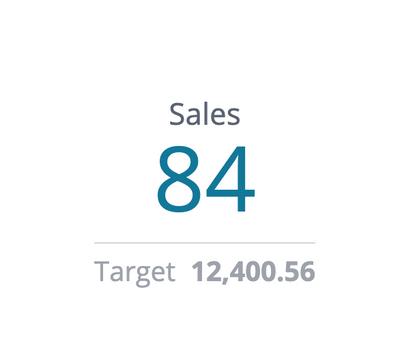
Good morning - I would like to create a 'simple' numerical indicator widget with a sales value as the primary metric and the target sales value as the secondary metric. The target sales value is stored in an excel sheet with a structure like this: ...
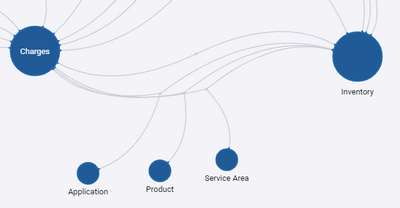
Core issue: Dashboard filter is showing selectable categories which have no values in the table used by the dashboard. Example: I have a dashboard which presents data from the Charges (fact) table below. There is no reference to the Inventory table ...
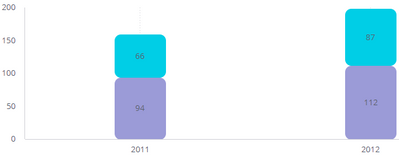
When creating a column chart, you might want to design it to have rounded corners To round all corners - Apply the following widget script: widget.on('processresult',function(widget,result) { result.result.plotOptions.column.borderRadius = 10;}); B...
I'm starting out trying to create Blox widgets. Most of these are not intended extend dashboard functionality to show sparklines and to put filters on the dashboard rather than to the side of it. So I'd like these widgets to fit in with the styling ...
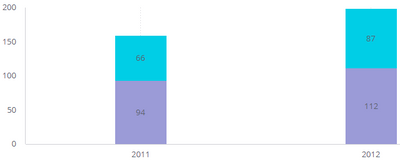
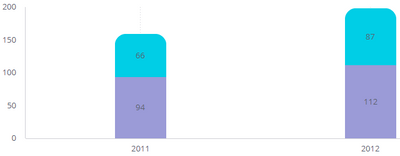
Sisense limits a user from defining more than 3 column values to make sure that the underlying SQL (group by) query doesn't get too complex (notice the missing '+'): However, in some cases, a user would like to add more than 3 values. These include:...
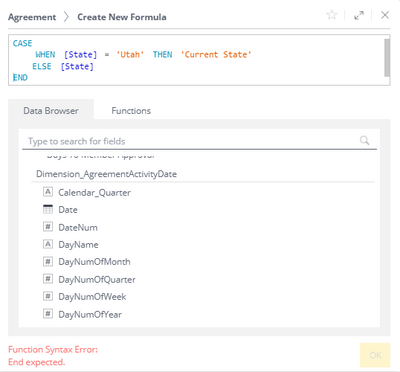
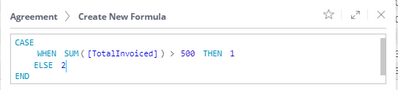
Hi, I am trying to create a new dimension base off of a case statement in the widget editor, but I can't get it to work (unless it's based on a value). For example, this first snippit (this is what I need) won't work . The second will. I don't wan...
Great content you missed that you never planned on reading
They are a great place to connect, learn, and grow.
→Click here to check out the Software Developers Forum←
Recommended Quick Links
Developers:
Product Feedback Forum:
Need additional support?:
The Legal Stuff
Have a question about the Sisense Community?
Email community@sisense.com
