How to hide the "Switch to view mode" button based on a role
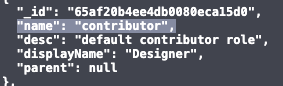
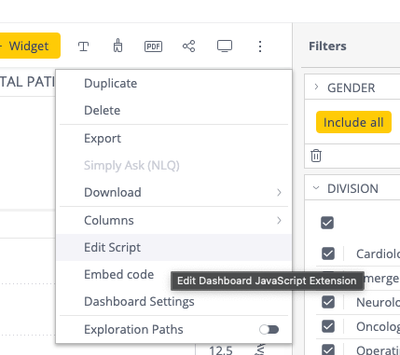
How to hide the "Switch to view mode" button based on a role This article provides an example JavaScript snippet that could hide the "Switch to view mode" button based on the user's role. How to use it? First of all, you need to get the role name y...