- Mark as New
- Bookmark
- Subscribe
- Mute
- Subscribe to RSS Feed
- Permalink
- Report Inappropriate Content
03-08-2023 05:04 AM
Hi all,
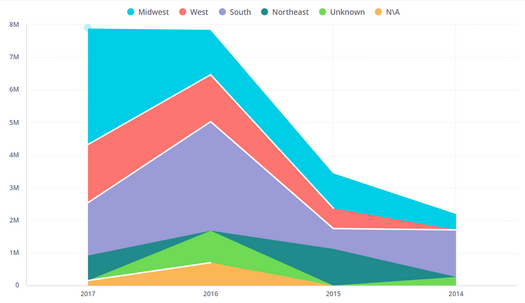
I'm wondering whether it could me made possible to change the order in which layers are stacked in a Stacked Area Chart.
For example: comparing the split between apples and oranges in a certain garden over time, where I would like the orange-part to be on top, whilst Sisense would probably put the apples on top because of automatic alphabetical ordering in the break-by dimension.
When there are a lot of layers in such a graph, it really helps with putting your message across when your able to stack the more irrelevant layers at the bottom, showing the impact in the higher ones.
Graphically:
This is what Sisense would do:
Yet in that graph the message is that ‘raisins’ is the one affecting whatever we’re looking at, and that is much more clear in the way below.
I’ve included how plain old excel handles that in the screenshot. Those up & down arrows.
My only question at this time is whether-and-if-yes-then-how Sisense is able to handle that.
(I know I can put in the same field in the dimension ‘values’ multiple times with a filter, so I can change the order of the value-fields. But the big downside is that when there’s a new value showing up in the used dimension, say Carrots, my users will be blind to it, because Carrots will simply not show up in the graph as it’s blocked by those filters used in that workaround.)
All ideas are welcome! Thanks!
- Labels:
-
Dashboards & Reporting
- Mark as New
- Bookmark
- Subscribe
- Mute
- Subscribe to RSS Feed
- Permalink
- Report Inappropriate Content
03-08-2023 09:25 AM
Hi @wPaardekooper ,
Try the script in below post to sort items in Area/Bar/Column/Line chart:
https://www.binextlevel.com/post/sort-bar-columns-breakby-manually
Example:
-Hari


