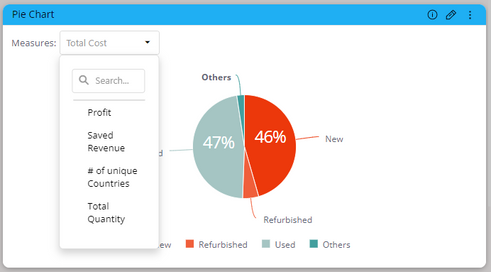
Pie Chart with Multiple Values
- Mark as New
- Bookmark
- Subscribe
- Mute
- Subscribe to RSS Feed
- Permalink
- Report Inappropriate Content
03-27-2023 08:00 AM
I have a very specific use case to build a pie chart with multiple value labels. A rough example is below, but essentially the use case is to have a pie chart show the % based off one value, but then display a second metric below that.
Any thoughts or suggestions on how to pursue this? I know a stacked bar should bring a similar analytical value to the company, but for this use case, I can't get around the need for this formatting.
- Labels:
-
Dashboards & Reporting
-
Retail
- Mark as New
- Bookmark
- Subscribe
- Mute
- Subscribe to RSS Feed
- Permalink
- Report Inappropriate Content
04-04-2023 03:17 AM
Hi @blakedavidson ,
I'm not entirely certain I grasp the goal you're aiming for. However, if you wish to display multiple values without employing "Category" in the widget, you may simply select the + button and add measures.
Sisense will then adapt the widget's UI and configure the Pie chart to encompass solely measures:
Alternatively, you could utilize the Measure Changer premium plugin from Paldi Solutions, which enables you to establish categories and alter measures directly from the widget toolbar:
By using this plugin, you can display measures for categories and quickly modify measures as needed.
We offer free trials, so please don't hesitate to contact me and request one for evaluation in your environment.


