Options
- Mark as New
- Bookmark
- Subscribe
- Mute
- Subscribe to RSS Feed
- Permalink
- Report Inappropriate Content
05-28-2024 03:48 PM
I have a widget where I have edited the script to apply custom formatting (changing the “time” from being displayed in seconds => to minutes & seconds). However, when I display this widget in my React project with the <LineChart {...widget.getChartProps()}/> component from sdk-ui, the custom formatting is not showing up. Is there something special I need to do here to be able to see this custom script styling in the sdk-ui component? I’m not finding any community posts describing this problem or a solution.
Labels:
- Labels:
-
Developers
-
React
2 ACCEPTED SOLUTIONS
Options
- Mark as New
- Bookmark
- Subscribe
- Mute
- Subscribe to RSS Feed
- Permalink
- Report Inappropriate Content
05-30-2024 02:59 PM - edited 05-30-2024 03:01 PM
Hi @ewoytowitz
Alright, thanks for providing the example. Here is a Compose SDK version of the same, using `onBeforeRender` prop.
import { Chart, ChartProps, useGetWidgetModel } from "@sisense/sdk-ui";
import { useState } from "react";

function CodeExample() {

  const { widget } = useGetWidgetModel({
    dashboardOid: '<your_dashboard_id>',
    widgetOid: '<your_widget_id>',
  });

  const [chartProps, setChartProps] = useState<ChartProps>();

  if (widget && !chartProps) setChartProps(widget.getChartProps());

  function convertRawTime(seconds: string) {
    var totalSeconds = parseFloat(seconds); // Ensure we're working with a number, maintaining decimals
    var sign = totalSeconds < 0 ? '-' : '';
    var absTotalSeconds = Math.abs(totalSeconds);
    var minutes = Math.floor(absTotalSeconds / 60);
    var preciseSeconds = (absTotalSeconds % 60).toFixed(2); // Keeps two decimal places for seconds
    var formattedTime = (minutes < 10 ? minutes : minutes) + ":" +
      (parseInt(preciseSeconds) < 10 ? "0" + preciseSeconds : preciseSeconds);
    return sign + formattedTime;
  }

  return (
    <>
      {chartProps &&
        <Chart
          chartType={chartProps.chartType}
          dataSet={chartProps.dataSet}
          dataOptions={chartProps.dataOptions}
          filters={chartProps.filters}
          highlights={chartProps.highlights}
          styleOptions={chartProps.styleOptions}
          onBeforeRender={(options: any) => {
            options.series.forEach(function (series: any) {
              series.dataLabels = {
                enabled: true,
                borderRadius: 5,
                backgroundColor: 'rgba(250, 250, 250, 0.7)',
                formatter: function () {
                  // Assuming 'y' holds the time in seconds with milliseconds
                  return convertRawTime(this.y);
                }
              };
            })
            return options;
          }}
        />
      }
    </>
  );
};

export default CodeExample;
Hope it helps!
Steve
Options
- Mark as New
- Bookmark
- Subscribe
- Mute
- Subscribe to RSS Feed
- Permalink
- Report Inappropriate Content
05-31-2024 06:00 AM
Hi @ewoytowitz
You can customise the tooltip using the same convertRawTime function, however by modifying the tooltip formatter function, you lose the Sisense style tooltips and will revert to highcharts default tooltips.
To avoid losing that style, I manually recreated the same tooltip structure that Sisense generates, but added the customRawTime function in there too, so this should solve your question.
You can add this to the onBeforeRender handler right before the return options; line
options.tooltip = {
              ...options.tooltip,
              formatter: function () {
                console.log(this);
                return '<div style="min-width: 100px; color: rgb(91, 99, 114); font-size: 13px; line-height: 18px; margin: 4px 6px;">'
                + this.series.name + '<br/>'
                + `<span style="font-size: 15px; line-height: 18px; color: ${this.point.color}">` + convertRawTime(this.y) + '</span>'
                + '<hr class="csdk-border-t" style="margin: 7px 0px;">'
                + this.x
                + '</div>';
              }
            };
Please note some other types / configurations of charts might have different tooltip contents (e.g .stacked charts) so this function would need adapting in those cases.
Thanks
Steve
11 REPLIES 11
Options
- Mark as New
- Bookmark
- Subscribe
- Mute
- Subscribe to RSS Feed
- Permalink
- Report Inappropriate Content
05-29-2024 03:47 AM - edited 05-29-2024 07:31 AM
Hi @ewoytowitz
Thanks for the great question!
The existing widget scripts will not affect Compose SDK behaviour, as scripts are executed in the Sisense Fusion application when the various lifecycle events happen.
The approach for Compose SDK is to allow you to apply customizations in your app code, instead of within widget scripts.
Here's an example of modifying an existing widget grouped by some date column, and changing both the aggregation granularity to minutes and also the display format.
import { Chart, ChartProps, useGetWidgetModel, CartesianChartDataOptions, StyledColumn } from "@sisense/sdk-ui";
import { Column, DateLevels } from "@sisense/sdk-data";

function CodeExample() {

  const { widget } = useGetWidgetModel({
    dashboardOid: '<your_dashboard_id>',
    widgetOid: '<your_widget_id>',
  });

  const getChartProps = () => {

    if (!widget) {
      return null;
    }

    const widgetProps = widget.getChartProps();

    return {
      ...widgetProps,
      dataOptions: {
        ...widgetProps.dataOptions,
        category: (widgetProps.dataOptions as CartesianChartDataOptions).category.map((col: Column | StyledColumn) => {
          if ('column' in col && (col.column.type === 'datelevel' || col.column.name === 'The Time Column')) {
            return {
              ...col,
              granularity: DateLevels.AggMinutesRoundTo1,
              dateFormat: 'HH:mm:ss',
            }
          }
          return col;
        }),
      }
    }
  }

  const chartProps = getChartProps() as ChartProps;

  return (
    <>
      {chartProps && (
        <Chart
          chartType={chartProps.chartType!}
          dataSet={chartProps.dataSet}
          dataOptions={chartProps.dataOptions}
          filters={chartProps.filters}
          highlights={chartProps.highlights}
          styleOptions={chartProps.styleOptions}
        />
      )}
    </>
  );
};

export default CodeExample;
I see that we might be missing the 'seconds' level of granularity in the DateLevels so we'll take a look into this.
I hope this helps, feel free to reply with more questions!
Thanks
Steve
Options
- Mark as New
- Bookmark
- Subscribe
- Mute
- Subscribe to RSS Feed
- Permalink
- Report Inappropriate Content
05-29-2024 08:56 AM - edited 05-29-2024 08:58 AM
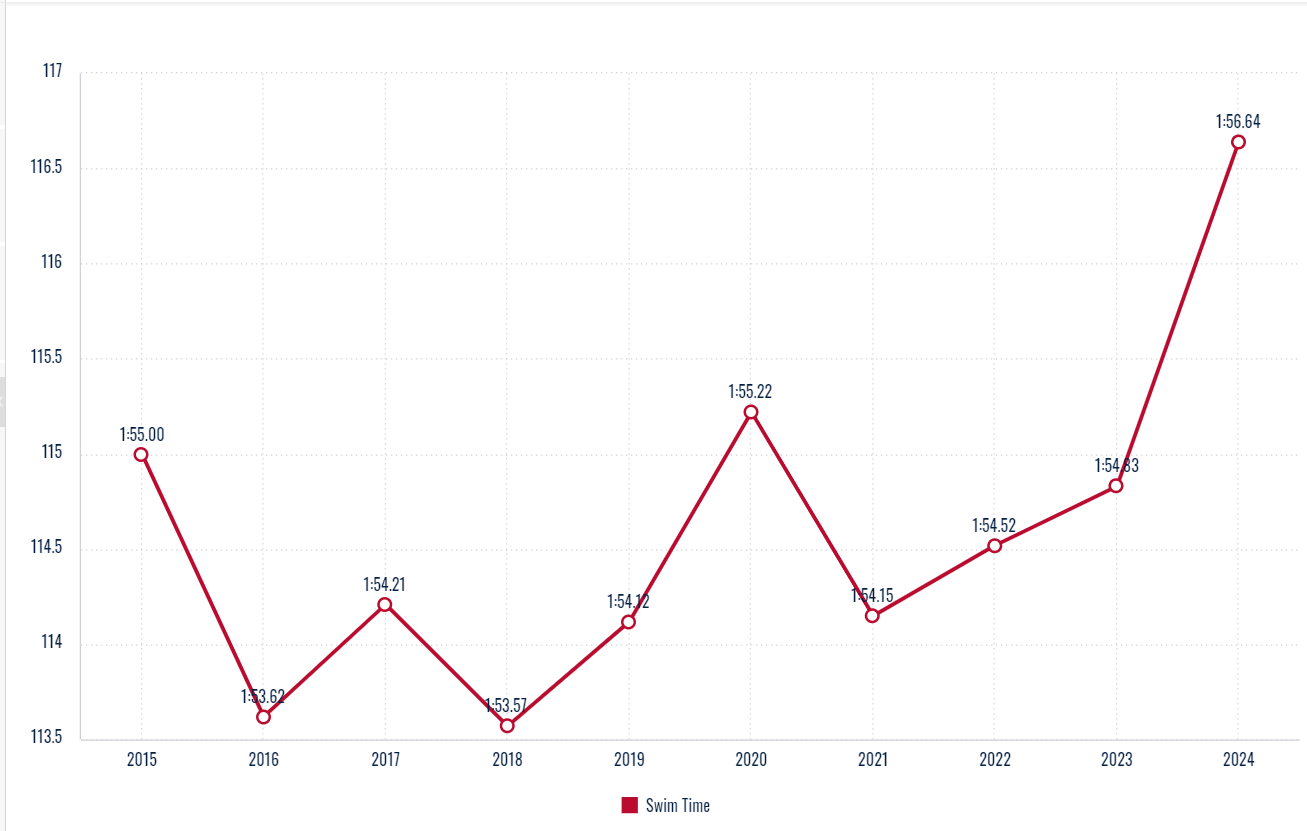
Hi Steve, thank you for the information. I've got the return set up from your CodeExample in my code. The data that I am trying to change the format of is on the y-axis, and the existing values are 'calculatedmeasure' (instead of 'datelevel'). Below is what I've come up with so far to work with my data, but I'm not sure how to apply my desired formatting to the 'newVal'? Do you know how I could go about that? Also, I really need to include milliseconds in the desired formatting, so I'm looking to apply a format of HH:mm:ss.00 to the existing ss.00 format. Including a screenshot of what the chart looks like now, without the desired formatting, for context.
useEffect(() => {
if (widget && !chartProps) {
setChartProps(widget.getChartProps());
}
if (chartProps && hookEnabled) {
const { value } = chartProps.dataOptions as CategoricalChartDataOptions;
let newValueList: (MeasureColumn | CalculatedMeasureColumn | StyledMeasureColumn)[] = value.map((val: any) => {
if (val.column.type === 'calculatedmeasure' || val.column._name === 'Swim Time') {
let newVal = val.column as StyledMeasureColumn;
} return val;
})
setChartProps({
...chartProps, dataOptions: {
...chartProps.dataOptions,
value: newValueList as [MeasureColumn | CalculatedMeasureColumn | StyledMeasureColumn]
},
});
setHookEnabled(false);
}
}, [widget, chartProps])
Options
- Mark as New
- Bookmark
- Subscribe
- Mute
- Subscribe to RSS Feed
- Permalink
- Report Inappropriate Content
05-29-2024 01:15 PM
@ewoytowitz thanks for the additional info
FYI i modified my post since you took influence from it, having some feedback from one of our team to simplify it a bit.
Ok now I understand your script is not about modifying the query itself, but modifying the format afterwards for presentation? e.g. dividing seconds by 60 to get minutes or something like this. Could you share a snippet of your widget script so we can understand the logic?
Steve
Options
- Mark as New
- Bookmark
- Subscribe
- Mute
- Subscribe to RSS Feed
- Permalink
- Report Inappropriate Content
05-29-2024 01:28 PM
Thanks for continuing to look into this. Yes, I would like to modify the swim time format afterwards for presentation (hours/minutes/seconds/milliseconds is easier to read than just seconds/milliseconds). Here is the script that the widget is currently using to make that presentation formatting change on the Sisense website. Attached is what the result looks like on the Sisense website (& what I would like my compose sdk chart to look like).
function convertRawTime(seconds) {
var totalSeconds = parseFloat(seconds); // Ensure we're working with a number, maintaining decimals
var sign = totalSeconds < 0 ? '-' : '';
var absTotalSeconds = Math.abs(totalSeconds);
var minutes = Math.floor(absTotalSeconds / 60);
var preciseSeconds = (absTotalSeconds % 60).toFixed(2); // Keeps two decimal places for seconds
var formattedTime = (minutes < 10 ? minutes : minutes) + ":" +
(preciseSeconds < 10 ? "0" + preciseSeconds : preciseSeconds);
return sign + formattedTime;
}
widget.on("render", function(w) {
// Apply the custom formatter to data labels for each series
w.queryResult.series.forEach(function(series) {
series.dataLabels = {
enabled: true,
formatter: function() {
// Assuming 'y' holds the time in seconds with milliseconds
return convertRawTime(this.y);
}
};
});
//w.refresh()
});
Options
- Mark as New
- Bookmark
- Subscribe
- Mute
- Subscribe to RSS Feed
- Permalink
- Report Inappropriate Content
05-30-2024 02:59 PM - edited 05-30-2024 03:01 PM
Hi @ewoytowitz
Alright, thanks for providing the example. Here is a Compose SDK version of the same, using `onBeforeRender` prop.
import { Chart, ChartProps, useGetWidgetModel } from "@sisense/sdk-ui";
import { useState } from "react";

function CodeExample() {

  const { widget } = useGetWidgetModel({
    dashboardOid: '<your_dashboard_id>',
    widgetOid: '<your_widget_id>',
  });

  const [chartProps, setChartProps] = useState<ChartProps>();

  if (widget && !chartProps) setChartProps(widget.getChartProps());

  function convertRawTime(seconds: string) {
    var totalSeconds = parseFloat(seconds); // Ensure we're working with a number, maintaining decimals
    var sign = totalSeconds < 0 ? '-' : '';
    var absTotalSeconds = Math.abs(totalSeconds);
    var minutes = Math.floor(absTotalSeconds / 60);
    var preciseSeconds = (absTotalSeconds % 60).toFixed(2); // Keeps two decimal places for seconds
    var formattedTime = (minutes < 10 ? minutes : minutes) + ":" +
      (parseInt(preciseSeconds) < 10 ? "0" + preciseSeconds : preciseSeconds);
    return sign + formattedTime;
  }

  return (
    <>
      {chartProps &&
        <Chart
          chartType={chartProps.chartType}
          dataSet={chartProps.dataSet}
          dataOptions={chartProps.dataOptions}
          filters={chartProps.filters}
          highlights={chartProps.highlights}
          styleOptions={chartProps.styleOptions}
          onBeforeRender={(options: any) => {
            options.series.forEach(function (series: any) {
              series.dataLabels = {
                enabled: true,
                borderRadius: 5,
                backgroundColor: 'rgba(250, 250, 250, 0.7)',
                formatter: function () {
                  // Assuming 'y' holds the time in seconds with milliseconds
                  return convertRawTime(this.y);
                }
              };
            })
            return options;
          }}
        />
      }
    </>
  );
};

export default CodeExample;
Hope it helps!
Steve
Options
- Mark as New
- Bookmark
- Subscribe
- Mute
- Subscribe to RSS Feed
- Permalink
- Report Inappropriate Content
05-30-2024 03:23 PM
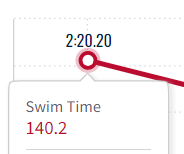
Amazing! Thank you. That worked! Is there a way to apply the same formatting to the value in the "pop-up" that appears when you hover over the data point? The pop-up is showing the unformatted value (see attached image), and I'd like it to show up as the formatted time if possible.
Options
- Mark as New
- Bookmark
- Subscribe
- Mute
- Subscribe to RSS Feed
- Permalink
- Report Inappropriate Content
05-31-2024 06:00 AM
Hi @ewoytowitz
You can customise the tooltip using the same convertRawTime function, however by modifying the tooltip formatter function, you lose the Sisense style tooltips and will revert to highcharts default tooltips.
To avoid losing that style, I manually recreated the same tooltip structure that Sisense generates, but added the customRawTime function in there too, so this should solve your question.
You can add this to the onBeforeRender handler right before the return options; line
options.tooltip = {
              ...options.tooltip,
              formatter: function () {
                console.log(this);
                return '<div style="min-width: 100px; color: rgb(91, 99, 114); font-size: 13px; line-height: 18px; margin: 4px 6px;">'
                + this.series.name + '<br/>'
                + `<span style="font-size: 15px; line-height: 18px; color: ${this.point.color}">` + convertRawTime(this.y) + '</span>'
                + '<hr class="csdk-border-t" style="margin: 7px 0px;">'
                + this.x
                + '</div>';
              }
            };
Please note some other types / configurations of charts might have different tooltip contents (e.g .stacked charts) so this function would need adapting in those cases.
Thanks
Steve
Options
- Mark as New
- Bookmark
- Subscribe
- Mute
- Subscribe to RSS Feed
- Permalink
- Report Inappropriate Content
05-31-2024 07:51 AM
Looks great! The tooltip now matches the standard styling and has the formatting. Thank you Steve!
Options
- Mark as New
- Bookmark
- Subscribe
- Mute
- Subscribe to RSS Feed
- Permalink
- Report Inappropriate Content
11-27-2024 02:14 PM
Any tips on getting this to work for stacked bar charts?
Options
- Mark as New
- Bookmark
- Subscribe
- Mute
- Subscribe to RSS Feed
- Permalink
- Report Inappropriate Content
11-27-2024 03:56 PM
I was able to get it to kind of work, but it's showing two tooltips now:
widget.on("beforeviewloaded", function(w, args) {
function convertRawTime(num) {
if (!num && num !== 0) return '0:00';
var sign = num < 0 ? '-' : '';
var hours = (parseInt(Math.abs(num) / 3600) % 24);
var minutes = parseInt(Math.abs(num) / 60) % 60;
var seconds = parseInt(Math.abs(num) % 60);
var minutesText = minutes < 10 ? "0" + minutes : minutes;
var secondsText = seconds < 10 ? "0" + seconds : seconds;
return sign + minutesText + ":" + secondsText;
}
// Format data labels
args.options.plotOptions.series.dataLabels.formatter = function() {
return convertRawTime(this.y);
}
// Format y-axis labels
args.options.yAxis[0].labels.formatter = function() {
return convertRawTime(this.value);
}
// Reset any existing tooltip settings
args.options.tooltip = null;
// Set new tooltip configuration
args.options.tooltip = {
enabled: true,
followPointer: false,
followTouchMove: false,
hideDelay: 0,
formatter: function() {
let total = this.total || this.y;
let percentage = ((this.y / total) * 100).toFixed(1);
let s = '<div style="min-width: 100px; color: rgb(91, 99, 114); font-size: 13px; line-height: 18px; margin: 4px 6px;">';
s += this.x + '<br/>';
s += '<hr class="csdk-border-t" style="margin: 7px 0px;">';
s += this.series.name + ': ' +
`<span style="color:${this.color}">` +
convertRawTime(this.y) +
` (${percentage}%)</span>`;
s += '</div>';
return s;
},
shared: false,
useHTML: true,
outside: false,
style: {
pointerEvents: 'none'
}
};
// Disable any chart-wide tooltip settings
if (args.options.plotOptions && args.options.plotOptions.series) {
args.options.plotOptions.series.tooltip = {
enabled: false
};
}
});
Options
- Mark as New
- Bookmark
- Subscribe
- Mute
- Subscribe to RSS Feed
- Permalink
- Report Inappropriate Content
12-02-2024 11:17 AM
Hi @haydenwitt. Do you still need help with this? If so I can reach out internally, or we have our live Office Hours in the Sisense Discord tomorrow at 1pm Central if you can stop in then and ask your question.
David Raynor (DRay)

