Anomaly Detection with Sisense using R
Anomaly Detection with Sisense using R

Anomaly Detection
AnomalyDetection is an open-source R package to detect anomalies which is robust, from a statistical standpoint, in the presence of seasonality and an underlying trend.
The AnomalyDetection package can be used in wide variety of contexts. For example, detecting anomalies in system metrics after a new software release, user engagement post an A/B test,
or for problems in econometrics, financial engineering, political and social sciences. The package will behave differently for different scenarios.
Additional information about how the package works as well as the package itself can be found here.
How to get started
Install the R package using the following commands on the R console:
install.packages("devtools")devtools::install_github("twitter/AnomalyDetection")library(AnomalyDetection)The function AnomalyDetectionTs is called to detect one or more statistically significant anomalies in the input time series.
The function AnomalyDetectionVec is called to detect one or more statistically significant anomalies in a vector of observations.
Both functions have several configurations and parameters which can be found with additional documentation by running the following commands respectively:
help(AnomalyDetectionTs)help(AnomalyDetectionVec)For more details on the AnomalyDetection package, visit https://github.com/twitter/AnomalyDetection
Sisense Example
In our example, we will plot daily data and with use of the AnomalyDetectionTS function in R, find the anomaly.
AnomalyDetectionTS will return a 0 value for non-anomalies and the value itself if recognized as an anomaly.
We will visualize the data plotted on a daily level, in 2 ways:
- Line Chart with data markers, where the anomaly will be colored in red
- Scatter Chart with which the anomaly will be conditionally formatted according to our R formula
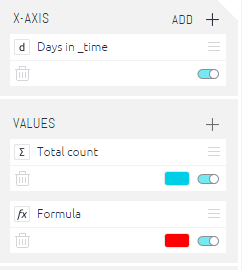
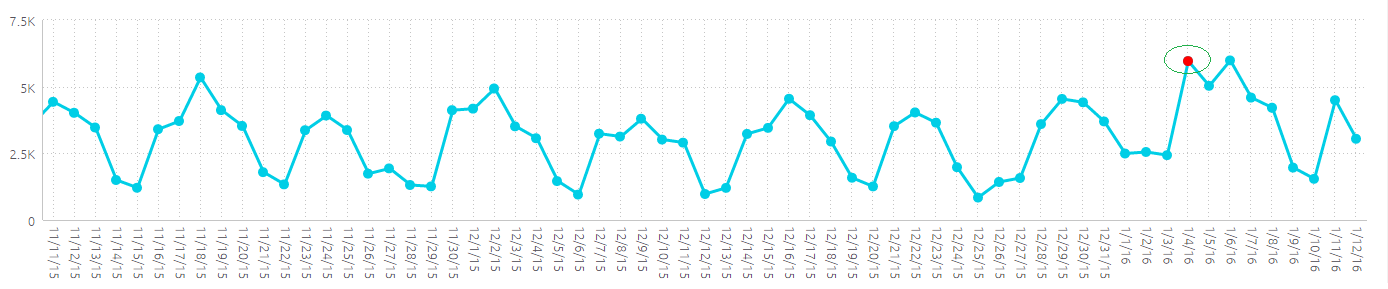
Line Chart
In our first example, we will plot days, Total Count and the R formula on a line chart. Setting markers on this line chart and configuring the colors accordingly, we will be able to see all the daily data, and the anomaly detected by a bold color:
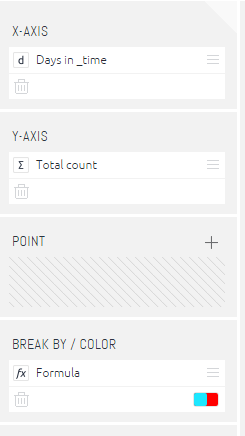
Scatter Chart
In our second example using a scatter chart, we will plot the dates on the x-axis, the Total Count as the y-axis, and break the color of the data markers by conditional formatting to point out the anomaly:
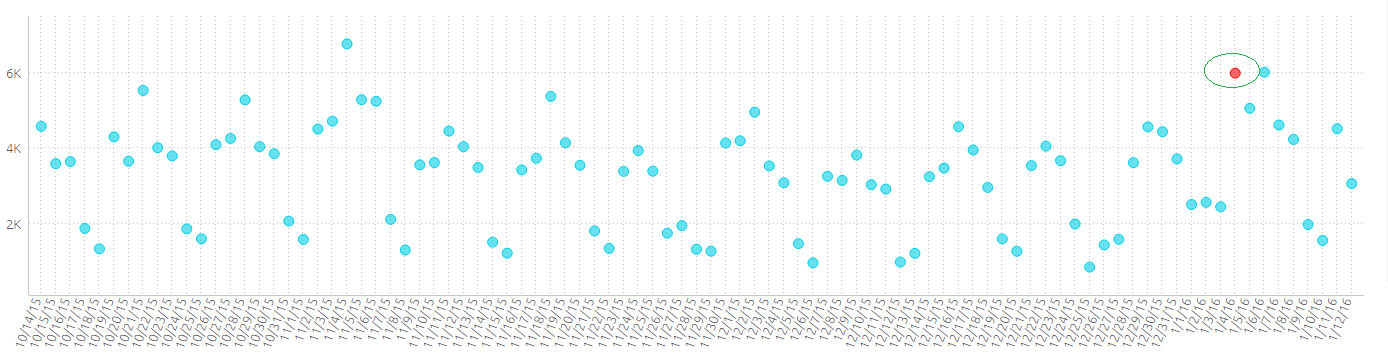
Note: By default, the x-axis dates’ labels will render horizontally, to plot them with an angle, add the following widget script to the scatter chart:
widget.on('render', function(se,ev){
se.queryResult.xAxis.labels.rotation = -70;
})
RDOUBLE function with R code
We’ll break the formula into several components:
RDOUBLE([recycle], “Rcode”, [Sisense arguments])
Recycle (True/False) - This is an optional parameter that controls whether the results from R should be recycled (cached), so that consequent queries will not have to be recalculated unless they or the data have changed.
Rcode – The R Code found following introduces the Sisense arguments into an R data frame and runs the AnomalyDetectionTS function on them.
Note that we’ll need to send the dates to R as integers, so we’ll need to initially create a custom column in the ElastiCube in this table which calculates the dates as such.
Name this custom column ‘date_int’.
In this example, we use the following formula:
getyear([_time])*10000+getmonth([_time])*100+getday([_time])Note: as stated above, this example is for daily granularity data, that is, the data is already aggregated at a daily level. For higher resolution time requirements, one can use a more detailed formula. Bear in mind that this will require further adjustment of the R code.
The R code will transform the integers representing dates into dates, and run the AnomalyDetectionTS function on them, together with the Total Count values per date, and return the anomalies detected.
Sisense Arguments – As stated above, we will need to transfer the dates in a numeric representation. This means that we’ll need to set this in the function as well. For this, we will send the Max(date_int) as a value, this will plot the corresponding value of date_int to its respective date. The Sisense arguments sent will be sent in the following order: [Max date_int],[Total count] where ‘Max date_int’ is our integers representing the dates, and ‘Total Count’ is the value we’re testing for anomalies.
Note that the R code registers the ‘AnomalyDetection’ library, this may require further adjustment of this library’s location:
library('AnomalyDetection', lib.loc='~/R/win-library/3.2');Following, please find the RDOUBLE function reference:
RDOUBLE(false,
        "df = data.frame(X_time=args[[1]], DailyFailedLogins=args[[2]]);
        df$X_time <- as.Date(as.character(df$X_time), format='%Y%m%d');
        df$X_time <- as.POSIXct(df$X_time);
        library('AnomalyDetection', lib.loc='~/R/win-library/3.2');
        res = AnomalyDetectionTs(df, max_anoms=0.02, direction='pos', plot=FALSE);
        df$X_time_key <- as.Date(substr(as.character.Date(df$X_time),1,10));
        res_df <- data.frame(X_time_key=as.Date(res$anoms$timestamp),anoms=res$anoms$anoms);
        final_df <- merge(x=df, y=res_df, by='X_time_key', all.x = TRUE);
        final_df$anoms",
        [Max date_int],[Total count])
For additional documentation for using R in Sisense formulas, please see this link.
Attached, please find .ecdata file as well as a .dash which holds the charts above, as well as additional methods for visualizing the above.
Download:
Updated 01-31-2024
intapiuser
Admin
Joined December 15, 2022