- Subscribe to RSS Feed
- Mark as New
- Mark as Read
- Bookmark
- Subscribe
- Printer Friendly Page
- Report Inappropriate Content
on 05-05-2022 01:30 PM - edited on 02-23-2024 09:19 AM by DRay
There are multiple factors that affect dashboard performance. A dashboard consists of widgets, plugins, scripts, filters, and, most important, queries. In this article, we will examine how to diagnose and pinpoint what may be slowing your dashboard down.
Important log files to check/collect
- Galaxy
- API gateway
- Query logs
- HAR file from browser developer tools
- Grafana/logz.io metrics.
Where to check above logs
For Linux : /var/log/sisense/sisense/
For Windows: C:/Program Data/Sisense/application-logs/ (Program Data is a hidden folder, enable option from view – hidden folder)
How to check grafana for linux customer: https://<your sisense url>/app/grafana
If the environments are managed by Sisense’s team:
1. Click on Admin → System Management → click on Generate Support File which contains combined.log
2. Provide an exact timestamp to the support team to investigate logs in detail.
Investigation Steps
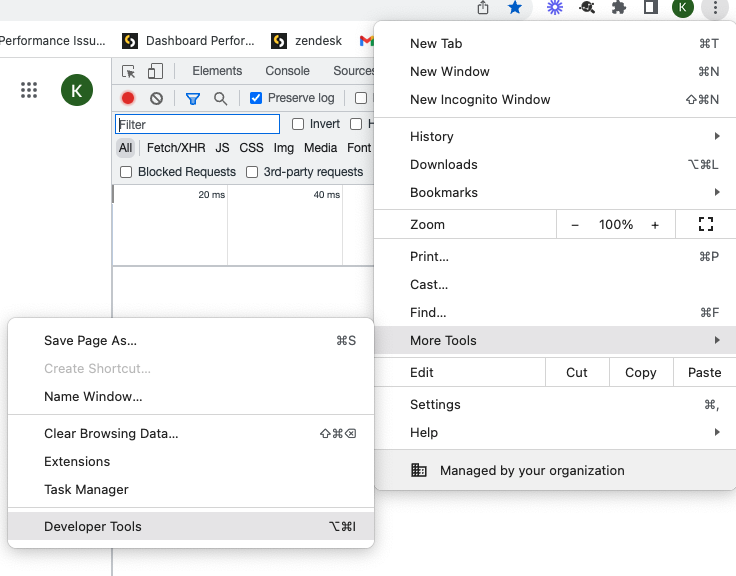
1. Open Right Click → More Tools → Developer Tools in your browser window. Go to the Network tab and verify which API calls are taking a longer time or failing. We can grab X-Request from the failed API call and analyze the log files for more details.
https://support.sisense.com/kb/en/article/generating-a-har-file-for-troubleshooting-sisense
2. Depending on the Sisense server you are using, you might need to look for different monitoring tools. Open Grafana for Linux server and logz.io for Windows server and check for CPU and Memory Usage for the timestamp. If memory consumption is high because of the dashboard, then verify many-to-many connections using the Jaql plugin.
3. Open Task Manager on Windows server to check usage to identify which service is utilizing more resources on the server. On a Linux server, run the “top” command and capture the output. Use the Describe pod option to check the memory requested and the maximum limit set on the pod. If the memory request is maxing out the set limit on the pod, upscale the pod.
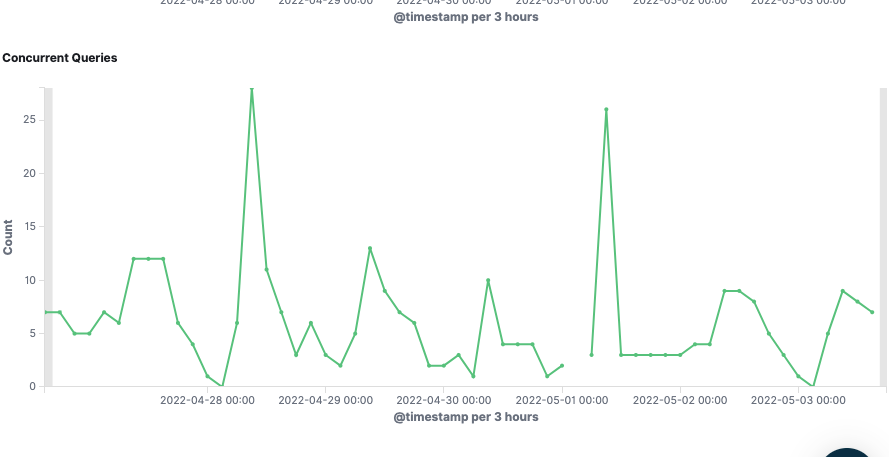
4. Check the graphs for concurrent queries on logz.io. Many concurrent queries could be taxing the Sisense server, causing slower load times. If this is the case, contact your Customer Success Manager and ask them about increasing the size of your hardware.
On the logz.io dashboard scroll down to check the Concurrent Queries graph. If the external monitoring parameter is set to true for Linux server inside config.yaml then we can check this graph for the Linux server as well.
5. We can also check the number of builds running at that time or check the build schedules. Please note, if you have hourly builds running at the same time the dashboard is loading, the number of queries on the system may increase causing a dashboard loading issue.
Linux: Check Cron Jobs on the server
Windows: There is nothing available out of the box
6. If you have embedding, test the dashboard by loading the dashboard without embedding and see if it loads. You can collect the .HAR file while doing this test.
7. If you have any script running on the dashboard, remove/comment out the script, and verify if the dashboard loads correctly. If the dashboard loads correctly, a problem may exist in the script.
8. If you have any custom plugins on the dashboard, try to disable that specific plugin and test.
9. If the problem is affecting multiple dashboards at the same time, restart the API gateway pod/service and verify.
Linux: kubectl get pods -n sisense – find the name of the API gateway pod and then restart the API gateway pod using the below command:
Kubectl -n sisense delete pod <pod name>
Windows: open Services → right-click on API gateway service pod → Restart
If the environments are managed by Sisense’s team you can reach out to Sisense Support for service restart.
10. Sometimes restarting the query pod also helps as it clears out the cache. First, ensure that no builds are running, otherwise, the build will fail.
11. If you are using security rules in the data source for this dashboard, the load times may increase because the security rules must be processed during the loading process. The processing time of these requests depends on the resources on the server, mostly CPU. In this case, we can decrease the number of widgets and filters, or split the dashboard into multiple dashboards to decrease the load times of this dashboard. Splitting the dashboard will reduce the concurrent queries to the data source, and reduce load time. Another alternative is to increase the CPU on the servers.
If you need any additional help, please contact Sisense Support and a Support Engineer will assist.


