- Community
- Community Blogs
- Product and Website News
- Maximizing Performance Insights: Why Sisense Offer...
- Subscribe to RSS Feed
- Mark as New
- Mark as Read
- Bookmark
- Subscribe
- Printer Friendly Page
- Report Inappropriate Content
Maximizing Performance Insights: Why Sisense Offers a Complementary Edge for k6 Test Results
In the quest for optimal software performance, thorough testing and insightful analysis are paramount. Performance testing tools like k6 equip developers with the means to simulate various user interactions and stress scenarios, ensuring applications can endure real-world demands. However, the true value of these tests lies in the ability to effectively visualize and interpret the results — a task that demands robust visualization tools. While Grafana, paired with InfluxDB, has long been favored for its dynamic dashboards and real-time monitoring capabilities, Sisense emerges as a potent complementary tool, providing distinct advantages for specific visualization needs.
Background
k6 Performance Testing: k6 is renowned for its ability to conduct comprehensive performance testing, offering detailed insights into how applications behave under varied loads and conditions.
Visualization Tools in Performance Testing
The visualization of performance test results is critical for making data-driven decisions. Grafana, with its capability to support a wide range of data sources and its real-time data streaming, stands out in this domain. Its comprehensive alerting system is particularly effective for 24/7 application performance monitoring.
Grafana's Approach
Grafana, a stalwart in the visualization space, excels with its dynamic dashboards and extensive data source support. Its prowess in real-time data streaming and alerting systems makes it unparalleled for continuous monitoring. However, its preference for a continuous timeline presentation may not align with all testing scenarios, especially those that are event-based or require more nuanced analysis periods.
The Sisense Alternative
Sisense differentiates itself with superior data integration, customizable analytics, and user-friendly dashboards. It stands as a valuable tool for situations where traditional visualization methods fall short, offering flexibility and depth in analysis that can complement the real-time monitoring strengths of Grafana.
Process Overview and Use Cases
Exploring the versatility of Sisense through two primary use cases highlights its utility:
Minimal Recommendations
- Set up a k6 project using TypeScript for performance testing.
- Set up a Playwright project in TypeScript containing scripts to gather data into Snowflake DB post-k6 testing,
- Establish a table within Snowflake DB to store the collected data.
- Enhanced Database-Driven Analysis with k6 and Sisense
The process of database-driven analysis for performance test results involves several technical steps, from setting up k6 tests with custom metrics to visualizing these metrics in Sisense. Here's how you can implement this approach:
1.1. Setting Up k6 Tests with Custom Metrics
Begin by creating a k6 test script that includes a series of REST API calls. Within this script, initialize a Trend object to represent a custom metric for tracking the duration of specific API calls. For example:
This metric will be used to record the duration of specific API calls, such as fetching settings from an application:
1.2. Running k6 Performance Tests and Exporting Results
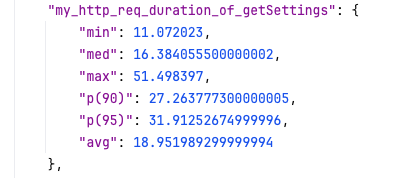
Execute the k6 performance tests with the --summary-export parameter to generate a summary report in JSON format, which will contain calculated metrics like the minimum, maximum, median, and average durations of the API calls:
Example of JSON report:
1.3. Parsing the Summary Report and Storing Data in Snowflake
After the tests, parse the summary report to extract relevant metrics. This step typically involves a custom script that identifies specific runs and application versions, recording them into a Snowflake database. Automate this process via a Playwright script executed in a Jenkins pipeline, immediately following the k6 test executions.
1.4. Visualizing Performance Metrics with Sisense
With the data recorded in Snowflake, the next step is to use Sisense for data visualization:
- Create a Live Data Model: Establish a connection to the Snowflake table within Sisense and create a live data model that reflects the structure and metrics of your performance test results.
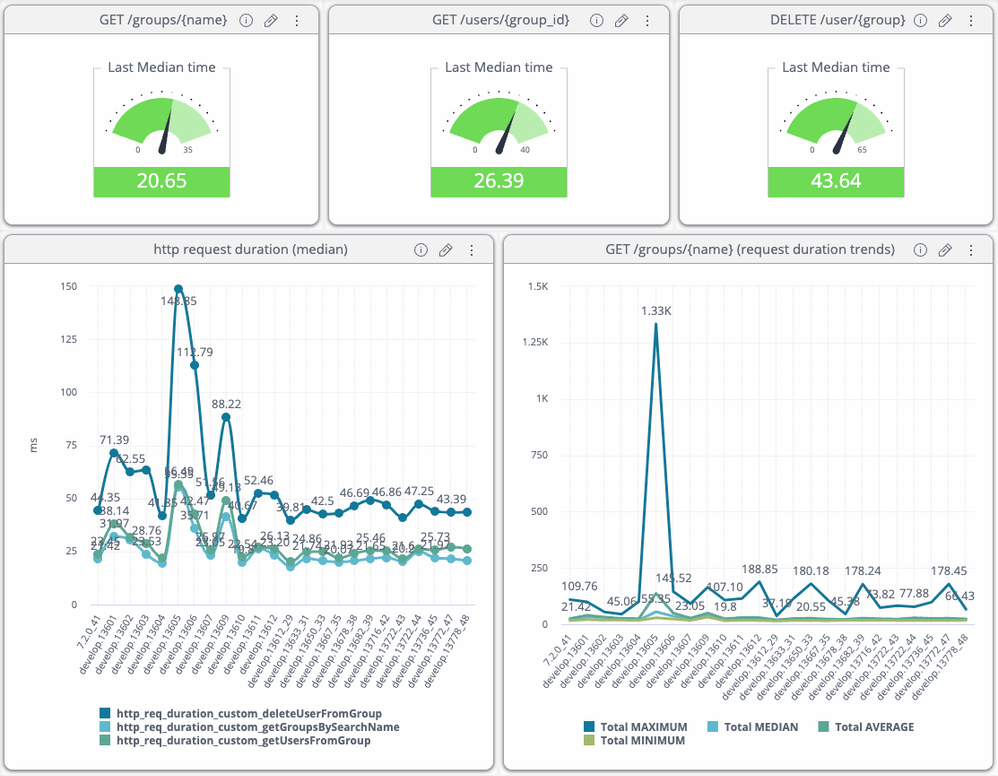
- Develop Custom Dashboards: Using the live data model, create dashboards with widgets tailored to visualize specific performance metrics. For instance, a line chart widget could depict the median, average, maximum, and minimum durations of HTTP request times for different API calls across various application versions.
The automated nature of these tests, coupled with the daily execution schedule, ensures that the Sisense dashboards are regularly updated with the latest data.
Advantages: This approach is ideal for organizations conducting interval-based testing or analyzing trends over time. It provides a comprehensive view of performance across various test executions, facilitating a deeper understanding of application behavior under different conditions.
It also allows teams to easily spot performance improvements or degradations between application builds, tracing them to specific code changes. The power of Sisense in this workflow lies in its ability to provide a dynamic and interactive visualization platform, enabling teams to make data-driven decisions based on comprehensive performance analysis.
- Deep Dive with CSV-Based Reporting and Sisense
For teams needing to analyze the nuances of performance test results, particularly the behavior of individual API calls within a single test execution, Sisense's data model based on CSV reporting offers a detailed analytical approach.
2.1. Run the k6 test and generate a CSV Report
Execute the k6 test with the configuration to output results into a CSV file. This file will contain granular data for each API call made during the test, providing a comprehensive dataset for analysis.
2.2. Creating an Elasticube Data Model in Sisense
Import the CSV file into Sisense during the creation of an Elasticube data model. This model allows for the flexible manipulation and aggregation of test data, serving as a robust foundation for dashboard creation.
2.3. Dashboard and Widget Construction
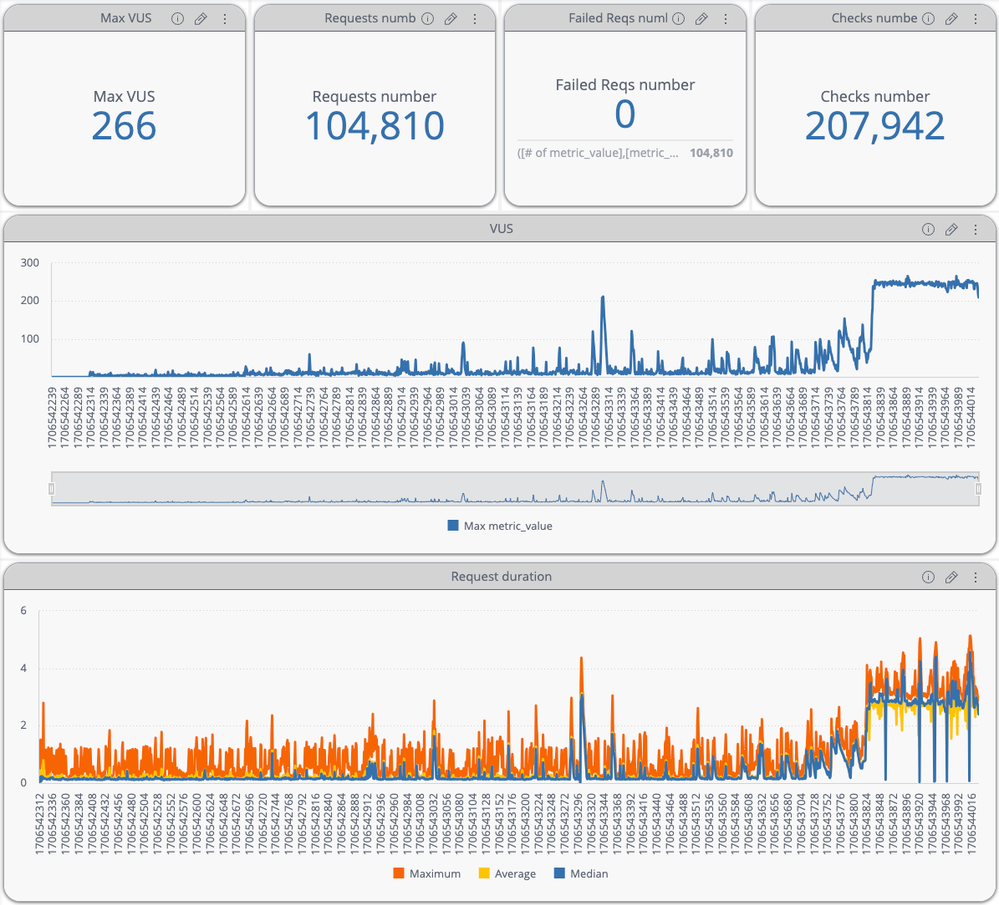
Utilize the Elasticube as the data source to build dashboards within Sisense. These dashboards can feature a variety of widgets designed to visualize the performance trends of API calls throughout the test execution. For instance, line charts can display the progression of response times, highlighting any anomalies or performance spikes that warrant further investigation.
This CSV-based approach provides a microscopic view of performance metrics, enabling teams to dissect each API call's behavior during a test. Visualizing these details through Sisense dashboards allows for a thorough examination of performance trends and the identification of potential bottlenecks or areas for optimization.
By integrating k6 with Sisense, teams can dive deep into individual test executions with CSV-based reporting, Sisense enhances the ability to derive meaningful insights from performance data, ensuring that software applications meet and exceed user expectations. It’s perfect for dissecting results from particular tests, this approach allows for rapid setup and analysis, bypassing the need for continuous data streams or complex database configurations.
Advantages of Using Sisense
Sisense brings to the table unmatched customization, seamless integration with diverse data sources, and an intuitive user experience, facilitating the creation and interpretation of complex data visualizations. This makes performance insights more accessible across an organization, enhancing the decision-making process.
Complementing Grafana with Sisense
Grafana's prowess in real-time monitoring and its comprehensive alerting capabilities are invaluable for ongoing application performance oversight. However, its continuous timeline visualization may not be ideal for all types of performance testing analyses, especially those requiring detailed examination of specific events or periods. Sisense addresses these scenarios by offering customizable visualization options that can adapt to varied analytical needs, from event-based reviews to in-depth trend analysis over time. Its ability to work with static datasets, like CSV reports, and integrate data from multiple sources, including databases, enables a broader spectrum of analysis, from real-time monitoring with Grafana to detailed post-test analysis with Sisense.
Conclusion
The integration of k6 with Sisense represents a refined method for visualizing performance test outcomes, merging k6's exhaustive testing capabilities with Sisense's sophisticated analytics and visualization prowess. This synergy facilitates a comprehensive examination of performance data, advancing from basic data collection to a detailed analysis that yields actionable insights. Sisense excels in customizing dashboards and widgets to fit specific data models, drawing from both databases and CSV reports, which enhances the robust testing framework provided by k6. This partnership enables teams to conduct thorough analyses of performance across various scenarios, pinpoint inefficiencies, and enact improvements efficiently. By combining k6's detailed performance data generation with Sisense's dynamic and insightful data visualization, organizations can significantly improve their performance testing strategies, leading to better application performance and superior user experiences.
At Sisense, engineers employ these two advanced approaches to rigorously test the performance of the Sisense platform itself, ensuring it upholds the highest standards of performance and user satisfaction. These methods exemplify the company's use of its technology to automate testing and leverage advanced data visualization, highlighting a commitment to maintaining a fast, reliable, and scalable platform. Through automated testing and the strategic use of Sisense for data analysis, the engineering team can quickly identify and rectify any performance issues, affirming Sisense's dedication to delivering a consistently high-quality user experience.
You must be a registered user to add a comment. If you've already registered, sign in. Otherwise, register and sign in.
- Business Requirements Gathering
- Unlocking Boundless Creativity: Introducing Compos...
- Sisense Community Changes
- Step into the Future of Analytics with Sisense!
- 2024 Academy Overview
- Why I’m excited about the Fusion Winter 2024 Relea...
- Maximizing Performance Insights: Why Sisense Offer...
- Sisense Winter 2024 Release in 6 Minutes!
- Sisense Academy Update!
- New year, Same End Goal!
Recommended quick links to assist you in optimizing your community experience:
- Community FAQs
- Community Welcome & Guidelines
- Discussion Posting Tips
- Partner Guidelines
- Profile Settings
- Ranks & Badges
Developers Group:
Product Feedback Forum:
Need additional support?:
The Legal Stuff
Have a question about the Sisense Community?
Email [email protected]
Share this page:


