Custom Map Widget
Download: Custom Map Widget
Note: (Sept 18, 2017) Added support for filtering on shapes.
Introduction
This article explains how to embed custom map visualizations in Sisense.
Purpose/Benefits
Sisense has some native mapping functionality but does not allow for importing custom maps. This plugin allows you to view data in whatever map you like. See the references for more information on GeoJSON, Leaflet, and Mapbox.
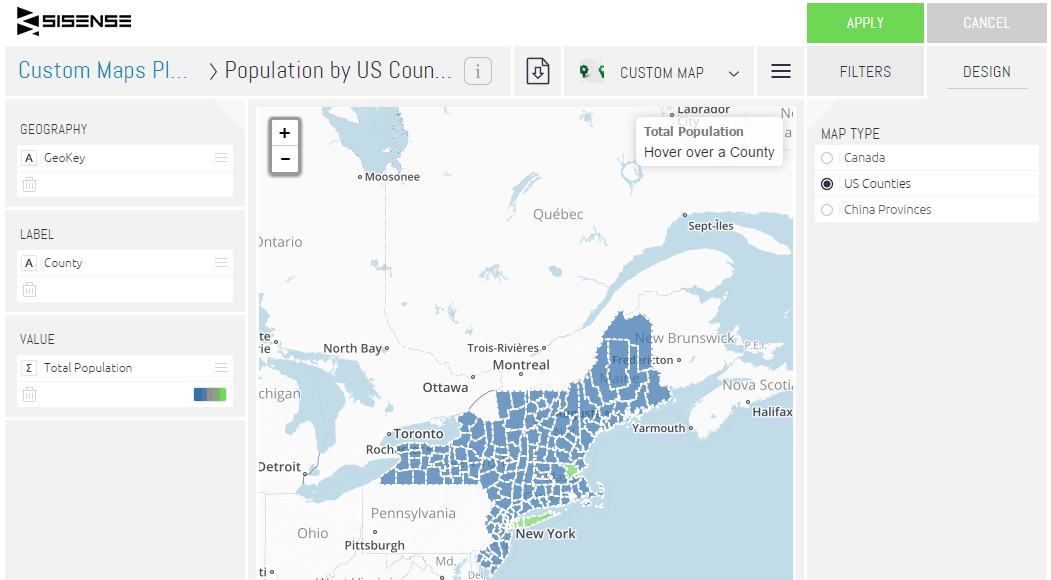
Custom shapes (Counties) overlayed on a base map:

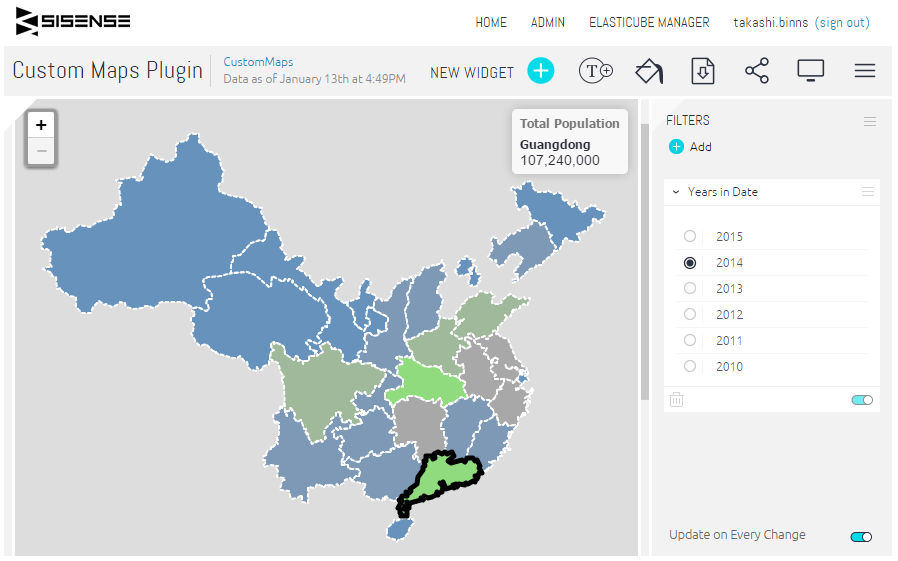
Custom shapes (Chinese Provinces) with no base map:
Steps
The following steps will walk through the process of adding the new chart type and creating a sample map.
STEP 1 - ADD THE PLUGIN
Download the customMapWidget.zip attachment and unzip the contents into your C:\Program Files\Sisense\PrismWeb\plugins\ folder. If you are using version 7.2 and higher unzip the contents into your C:\Program Files\Sisense\app\plugins\ folder. If the plugins folder doesn't exist, just create it. After those files have been unzipped there, you may also have to restart the web server. Now, when you create a new widget the Custom Map widget should show up in the list of options
STEP 2 - PREPARE GEOJSON FOR YOUR CUSTOM MAP
This plugin uses GeoJSON files to overlay data as shapes on a map. More information on GeoJSON can be found here, but the general concept is that each file defines a JavaScript object that has a type of FeatureCollection and a list of features. There are different types of features, but the most common type is a polygon. Each feature represents a shape to display on the map and contains properties and geometry. Properties describe the attributes of the entire shape, while geometry is a list of points. Each point is a latitude/longitude combination, and the mapping function displays all points of the shape on the map and then draws a line to connect them. Below is an example of the format for a GeoJSON file.
{
    "type": "FeatureCollection",
    "features": [
     {
            "type": "Feature",
          "properties": {
                "ID": "1",
                "Name": "MyShape1"
            },
            "geometry": {
                "type": "Polygon",
                "coordinates": [
                    [
                        [-86.411172, 32.409937],
                        [-86.496774, 32.344437]
                    ]
                ]
            }
        }
    ]
}
This plugin comes with 3 GeoJSON files included, but you can add in more if you want to show a different set of shapes. Some government agencies provide geo data for free use, and there are several 3rd party sites that provide free geo data as well. If you want to add in your own geo data, copy the file to customMapWidget/geojson/ folder.
STEP 3 - CONFIGURE THE PLUGIN
Open the config.js file and update the setting object's properties.
- urlTemplate - When using mapbox as the tiling server, you will need to provide a tile url
- mapboxKey - When using mapbox as the tiling server, you will need to provide an api key
- mapboxId - When using mapbox as the tiling server, you will need to provide a map type to use
- shapeSeparatorColor - color used for the outlines of the shapes
- shapeHighlightColor - color used to differentiate the highlighted shape
Next update the list of Map options. This is a list of all the map types that are allowed by the widget, so if you are adding a custom GeoJSON file make sure to add it to the list and set the properties accordingly
- label - Name that appears in the widget editor, for selecting a map type
- url - Path to the GeoJSON file
- showBaseMap - should be true or false, based on whether you want to overlay your data on a map
- keyAttributes - a list of attribute names to use as the key, these get concatenated together using the separator below
- keySeparator - character to use as a separator for the attribute key
prism.customMap = {
 settings: {
  mapboxKey: 'myMapboxApiKey',
  urlTemplate: window.location.protocol + '//api.tiles.mapbox.com/v3/sangil.i6ch70f8/{z}/{x}/{y}.png',
  mapboxId: 'mapbox.light',
  shapeSeparatorColor: 'white',
  shapeHighlightColor: 'black'
 },
 maps: [
  {
   label: 'Canada',
   url: '/plugins/customMapWidget/geojson/canada-GeoJSON.js',
   showBaseMap: true,
   keyAttributes:['NAME'],
   keySeparator:',',
  },
  {
   label: 'US Counties',
   url: '/plugins/customMapWidget/geojson/USCounties-GeoJSON.js',
   showBaseMap: true,
   keyAttributes:['STATE','COUNTY'],
   keySeparator:'',
  },
  {
   label: 'China Provinces',
   url: '/plugins/customMapWidget/geojson/china-provinces.js',
   showBaseMap: false,
   keyAttributes:['name'],
   keySeparator:'',
  },
 ],
 widgets: {}
};
STEP 4 - CREATE THE CHART
On your dashboard, click the Create Widget button and select Advanced Configuration. Next, select the Custom Map Chart from the chart types menu. Pick a map type from the menu on the right. This selection determines which shape file to load, so you can use this plugin to make several map types available. Next, pick a dimension to use for the Geography dimension. The values from this field need to match the attribute key defined in the map's keyAttributes field.
For example, this plugin comes with a GeoJSON file that provides the shape information for all counties in the US. If you open this file, each shape is has properties for STATE and COUNTY that uniquely identify each shape. The included Elasticube combines the STATE and COUNTY codes into a single field named GeoKey. In order to match up data from the Elasticube to the GeoJSON file, the config file specifies that the key is comprised of STATE and COUNTY.
The Label dimension (optional) identifies which field to use when displaying the tooltip. The US Counties example uses FIPS codes to identify each county, but you may want to show tooltips with the county names instead.
The Value measure is the number to embed into each shape. You can use the standard options to format the number, and the color selections get passed along to each shape.
References/Notes
- Mapbox API - More information about the Mapbox API. This plugin uses mapbox in order to render the maps, so it does require a Mapbox API Key in order to render shape overlays on top of maps. More information on Mapbox API pricing can be found here.
- LeafletJS - The Mapbox project is an extension of the Open Source LeafletJS JavaScript library. If you're looking to modify the plugin, this can be a useful reference.
- Natural Earth - This site provides free geo data for download, so if you don't have the geo data already you can likely get it from this site.
- MyGeoData - This plugin requires a lat/long coordinate system (WGS 84) in order to display overlays on top of maps. If you're custom geo data comes in a different format, this site can likely help convert it to WGS 84 format. Upload your geo files, and convert/export it to a geojson file using the WGS 84 coordinate system. Also, you may need to change the file extension from geojson to js in order for your web server to know how to handle this file type.
Updated 04-10-2025
intapiuser
Admin
Joined December 15, 2022