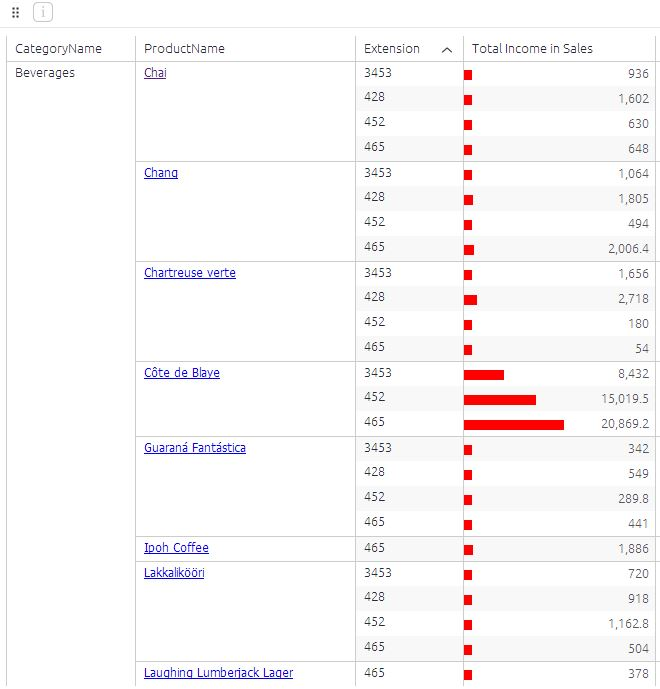
Change Color Of Data Bars In Pivot
Introduction
In this post we will explain how to change the color of the data bars in a widget
Purpose/Benefits
Adjust bar colors according to your need
Example

Steps
Step 1:
Create Pivot table and enable data bars on the measure field.
Step 2:
Open the widget script editor, copy and paste the following code there.
widget.on('ready', function(se, ev){

    $('.bar', element).css('background-color', 'red');
})
Step 3:
Hit Save. Refresh the page. Hit Apply.
Enjoy!
For multiple pivot table columns with data bars and a different color for each, please use the following script:
widget.on("ready",function(se,ev){
$(".databar[fidx=2] .bar-container .bar").css('background-color', 'red');
$(".databar[fidx=3] .bar-container .bar").css('background-color', 'blue');
});
Update the value for fidx to the index of your column. Columns are 0-indexed. For example, to modify the data bar in the fourth column of your pivot table, use fidx=3.
Updated 03-02-2023
intapiuser
Admin
Joined December 15, 2022