intapiuser
Community Team Member
Options
- Subscribe to RSS Feed
- Mark as New
- Mark as Read
- Bookmark
- Subscribe
- Printer Friendly Page
- Report Inappropriate Content
on 03-02-2023 09:48 AM - edited on 02-13-2024 12:16 PM by DRay
In order to control the RAM usage and to set up proper Data Group Limits, you would like to know how much RAM is used by a dashboard/widget.
In Linux, you can use Grafana, in Windows, you can use Performance Monitor
1. Make sure that no one else is using the dashboard connected to the same cube as the dashboard that you checking
2. Open three separate tabs in your browser:
- Dashboard you would like to check
- Grafana
- Elasticube Data Tab
3. Restart the query pod by:
- In Data Tab stop the cube that is a datasource of the Dashboard
- wait for 5-10 sec and start the cube (do not use the "restart" option, to get the correct result you need to stop and then start the cube)
4. In Grafana "All pods per namespace" dashboard filter for a newly created query pod of the cube by "ec-cube_Name" or by "qry"

enable autorefresh for more convenience

and check current usage
5. Refresh the tab with the dashboard. It will send the request to query pod to calculate the result
6. Check the RAM usage of a POD in Grafana

Using the same technique you can check widget usage, to do so open the required widget by pressing on edit (pencil) button, instead of the entire dashboard and you will be able to restart only the widget page that will send the query only from a particular widget.
check the video demo
The main reasons of the performance issues are:
- Heavy formulas are used inside widgets. In this case, you can move the calculations to a cube level i.e. create a custom table/column with formulas so they would be calculated when build, and on a dashboard, you will use results and aggregations etc
- Data Security. In the case of data security, the main issue is that the results of the queries that Sisense usually re-uses between customers cannot be reused. Data Security adds additional join with Data Security that makes sisense think that the query is unique and calculate result again.
- Many-to-many
Many-to-many
The many-to-many relationship is inflating your data due to duplication resulting from the Cartesian product generated from this relationship.
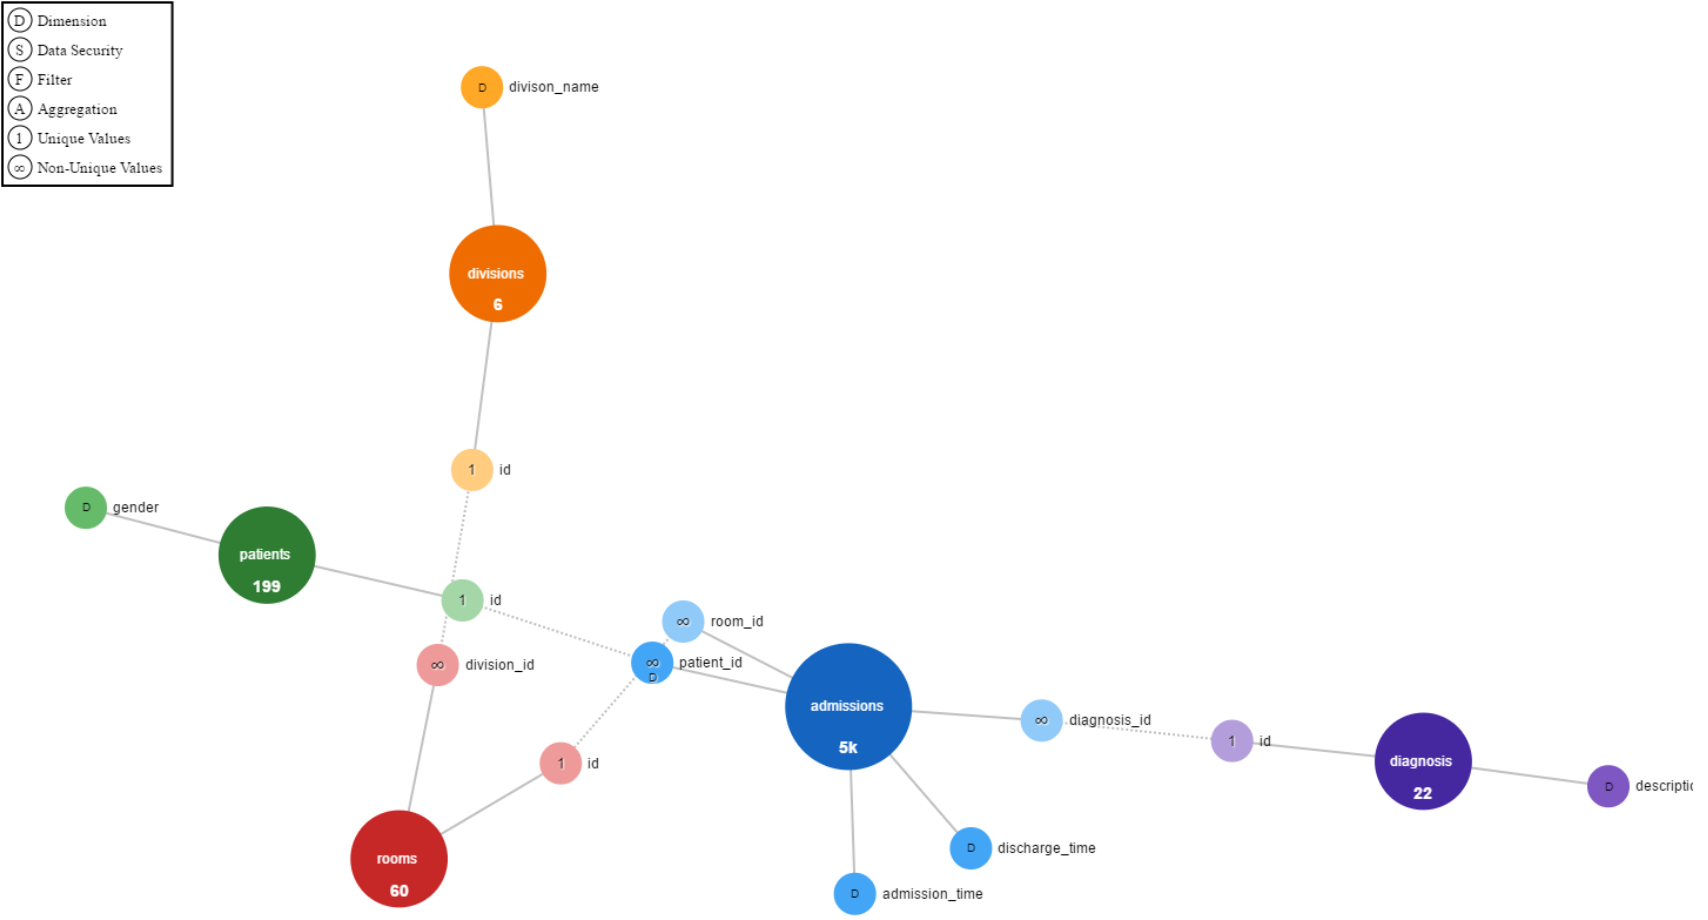
Sisense recommend installing the JAQLine plugin in order to inspect the connections between the tables:

For more information, see the following articles:
Also, please check a comprehensive guide we compiled to troubleshoot the performance issue.
Labels:
