So How Exactly Does R Work With Sisense?
To learn about how Sisense pipes data in and out of R and onto the display for visualization, we will review basic demos to make you say "aha!". Then we'll get a basic understanding of the underlying technologies that make this possible. Once you’ve got the idea of what technologies play what roles we'll take a look at Advanced Analytics and R utility examples and how they can impact your Advanced Analytics dashboarding needs.
What can I do with R?
Almost anything! Yes, R is just another programming language, albeit a specialized one. Just like you enter code into a console for execution, you can write R in Sisense RINT and RDOUBLE functions for execution!
Some Simple Examples
Let’s look at some simple examples that illustrate the versatility of the Sisense R functions and review a couple of simple rules for writing R functions in Sisense.
Demos:
- Create a CSV with the pivot table’s aggregated values
- Multiply [Numbers] times 10
- Make an API call on widget refresh and get the most up to date conversion rate
- Using R File Modules
LAYING THE GROUNDWORK
It probably won’t make too much sense until we get to the examples, but just bear these two rules in mind and you’ll be writing your own functions in no time.
- RINT
- Returns an array of INTEGERS.
- Must return an array (called a vector in R) the same LENGTH as the input array.
- RDOUBLE
- Returns an array of DOUBLES (decimals).
- Is NOT required to return a vector of the same LENGTH as the input array.
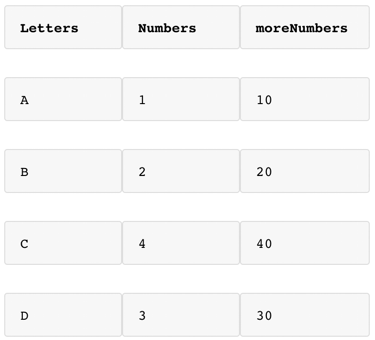
We’ll use this table as a data source for our demos.
DEMO 1: CREATE A CSV WITH THE PIVOT TABLE’S AGGREGATED VALUES
This Demo demonstrates what data gets passed to R when we run a Sisense function. We’ll save the data into a CSV so you can inspect it without having to open R.
- Create a pivot table
- [Letters] to rows
- Add a custom function to values column1 and enter the RINT() function with the following arguments
TRUEThis means we want to run the R formula on every widget refresh.
“RINT(TRUE, “write.csv(args[[1]], file = ‘C:\\ numbers.csv’, row.names = FALSE’, MAX([Numbers]); args[[1]])”Here we will put the R code to be executed.
MAX([Numbers]), MAX([moreNumbers])- The args object that Sisense passes to R consists of two elements, our first and second aggregation, in this case [Numbers] and [moreNumbers].
- In the example above we are only asking for [Numbers] because the selector next to args is set to 1 and Numbers is the first item in the list.
Once you’ve saved this widget, you should see a CSV file on your C drive called numbers.csv with the same content as your column1 in the pivot table!
Can you guess what would happen if we change the args[[1]] from one to two?
That’s right! It would overwrite the CSV with MAX([moreNumbers]) data and display [moreNumbers] data in the pivot!
DEMO 2: MULTIPLY [NUMBERS] TIMES 10
In this demo, we are not going to use any functions. Instead, we will demonstrate how to manipulate the set of data we pass to R. We will use the RDOUBLE function as we’ll be using arithmetic in our function. RDOUBLE is usually the safer bet in these conditions.
- Open edit mode for the widget we created above.
- Edit the R function value by first replacing RINT with RDOUBLE
- Replace the code inside the quotes with:
args[[1]] * 104. Now let’s compare the values to the original values of [Numbers] by placing MAX([Numbers]) in another value column.
Your code should be
RDOUBLE(TRUE, “args[[1]] * 10”, MAX([Numbers]), MAX([moreNumbers])You should see that our value has been multiplied by 10!
Can you guess what would happen if you swapped args[[1]] for args[[2]]?
DEMO 3: MAKE AN API CALL AND GET THE MOST UP TO DATE CONVERSION RATE
Now we’re really going to have some fun and push the limits of what we can do with this integration. We’re going to imagine that every one of those numbers above is an American dollar and we want to convert it to a Euro, but we can’t wait for the next build to happen! We need this conversion rate NOW!
- First, you will need to run install.packages(‘httr’) in the R GUI or command line to download the httr package that allows us to make GET requests.
- In the previous widget we will replace the second argument content with the following code:
library('httr');
apiElement <- GET('https://api.exchangeratesapi.io/latest?base=USD');
USDtoEUR <- content(apiElement, 'parsed')$rates$EUR;
args[[1]] * USDtoEUR;
Let’s walk through this code line by line together to understand what’s happening.
First, we say that we want to use the httr library. Then we make a GET request and put the response into a variable called apiElement. We use the content function to parse the content, get the desired information from it, and put the conversion rate into a variable. Finally, we multiply the MAX([Number]) by the conversion rate and return the outcome.
DEMO 4: USING R FILE MODULES
A neat option for longer code is packaging it in its own R file and calling it from the dashboard instead of writing it out in the function editor.
Take a look at how to do this in the example below.
RDOUBLE(TRUE,
"source('C:/Users/Administrator/Documents/R/ArtemExample/AddThirtyForecast.R'); module (args, 30);",
[Average Numbers])
The Complete Advanced Analytics Pipeline
Sisense leverages a technology called Rserve to pass instructions from the Sisense application to a dedicated data space and working directory for R execution without having to spin up an instance of R every time. Once processed, Rserve sends Sisense the results to be visualized.
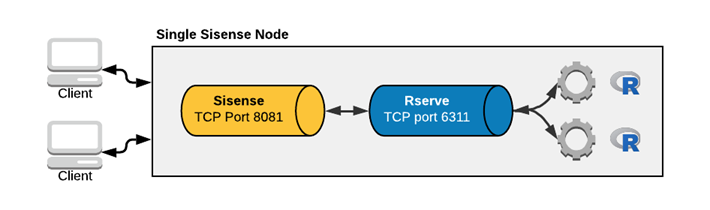
According to the Original Rserve Technology Paper, Rserve is a TCP/IP server which allows other programs to use facilities of R from various languages without the need to initialize R or link to the R library. Every connection has a separate workspace and working directory. Clientside implementations are available for popular languages such as C/C++ and Java. Rserve supports remote connection, authentication, and file transfer.
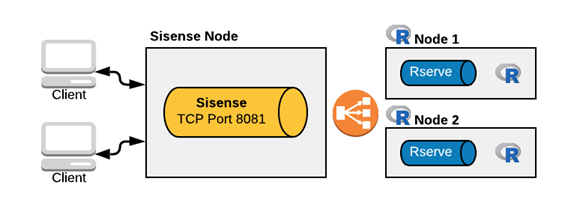
Scaling The Pipeline
Scaling the Advanced Analytics solution can be done by the decentralization of Sisense and Rserve nodes. In the multimode solution illustrated below, you can see how load balancing can direct users to a Rserve node with the most availability for processing. Rserve allows for the complete distribution of applications.
Advanced Analytics R Applications
Now that you know about how Rserve works, it's time to look at applications that can provide value to your business.
Take a look at the following pieces of documentation to start your creative juices flowing!
Updated 02-16-2024
intapiuser
Admin
Joined December 15, 2022