Embedding Custom Visualizations Within A Widget
Introduction
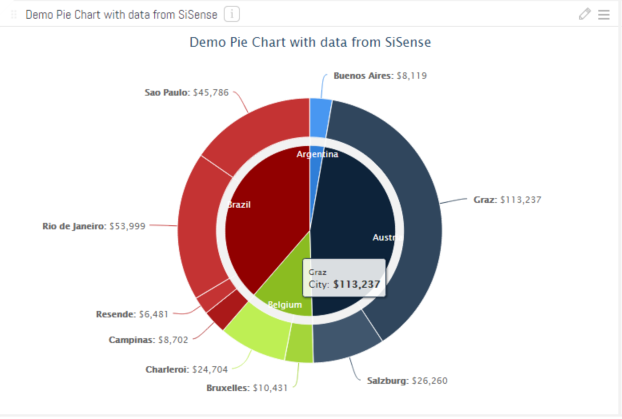
This document outlines the process for overriding an existing chart with a Highcharts Donut Pie chart. For a more robust solution, it is recommended to create a custom plugin as that would allow non-technical users to create charts without editing scripts. However, if this is a one-off solution, an existing widget’s script can be overridden to allow for integration with 3rd party charting solutions.
Steps
Here we will explain how to do it in detailed steps.
STEP 1 - CREATE THE SISENSE WIDGET
Try to be consistent with the image size along the post.
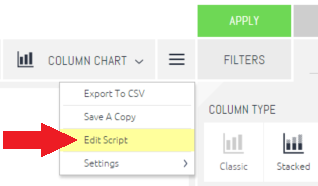
STEP 2 - COPY IN THE CUSTOM JAVASCRIPT
Click on the Edit Script button for the widget to pull up the script editor.
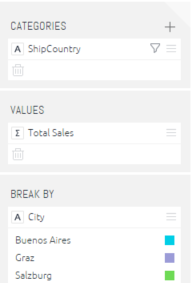
Open the attached JS file, then copy and paste the code into the script editor. The only thing that might need to be changes is to change the Highcharts div container ID. If you want more than 1 of these charts on the same dashboard, they need to have unique IDs. So just change the value of the JavaScript variable ChartDivName from “MyHighcharts” to “MyHighcharts2” or any other unique ID. Click the save button, and reload the dashboard. This code requires there to be a dimension specified as a Category, a second dimension specified under Break By, and a metric specified as a value. The screenshot below shows the setup used for the example.
Overview of custom JavaScript code
The code attached consists of the following 4 tasks:
1. RETRIEVE DATA FROM THE WIDGET
The results of the ElastiCube query are stored in the widget object, which is accessible through the sender variable. The dimensions/value names and data points are contained within the sender.rawQueryResult property. This data set will need to be transformed to fit the Highcharts data format.
2. FORMAT THE DATA
The data comes back from the query as an array consisting of data points in the following format: [CategoryName, DataPointName, DataPointValue]. This will need to be modified to match the format required by the desired 3rd party visualization tool.
3. REPLACE SISENSE CHART W/ NEW VISUALIZATION
The stacked column chart specified in this example gets rendered by the SiSense engine as a SVG element. This block of code finds the newly rendered stacked bar chart and replaces the svg tag with a div container for the Highcharts..
4. CREATE THE NEW VISUALIZATION
At this point, the data is formatted appropriately and the SiSense chart has been replaced with an empty container for the 3rd party visualization. This code block uses the Highcharts API to create a new donut pie chart within the specified div container.
Customizing the code
Following steps one and two will create a donut pie chart based on the given data set, but what if the required 3rd party chart was slightly different? The JavaScript would need to be customized to meet the requirements of the 3rd party chart. When pulling data from SiSense, the key object to look at is the sender.rawQueryResult variable. This object contains an array headers, which contains information about the dimensions and metrics specified by the widget. It also includes a variable values, which contains an array of all data points. These two objects can be looped through to build a data set compatible with the desired 3rd party visualization tool.
See also
Here we will put links to
- Highcharts Pie Donut Chart - http://www.highcharts.com/demo/pie-donut
- SiSense Widget API - https://sisense.dev/guides/customJs/jsApiRef/
The code snippet:
widget.on('ready', function(sender, ev){

 console.log('starting custom code');

 /**************************************************
  *** Retrieve data from the widget   ***
  ***           ***
  *************************************************/

 var ChartTitle = sender.title;
 var ChartDivName = "MyHighchart";
 //this ID must be unique for the whole HTML page,
 //so if you use multiple custom charts in the same dashboard then this will need to be changed

 //fetch data from widget
 var QueryResult = sender.rawQueryResult;
 var ChartMetric = QueryResult.headers[2];
 var ChartLevel1 = QueryResult.headers[0];
 var ChartLevel2 = QueryResult.headers[1];


 /**************************************************
  *** Format the data for Highcharts   ***
  ***           ***
  *************************************************/

 var ChartDataSet = QueryResult.values;
 var ChartCategories = [];
 var ChartValues = [];
 var ChartColors = Highcharts.getOptions().colors;

 //loop through data to build top level
 $.each( ChartDataSet, function() {

  //get category and value
  var MyCategoryName = this[0].text;
  var MyDataPointName = this[1].text;
  var MyDataPointValue = this[2].data;
  var MyDataPointColor;

  //look for existing category w/ matching name
  var ExistingCategory = $.grep( ChartCategories, function(el) {
   return (el.name == MyCategoryName );
  });

  //does it exist already?
  if ( ExistingCategory.length == 0 )
  {
   //category doesn't exist, so add it
   MyDataPointColor = ChartColors[ ChartCategories.length ];
   var NewCategory = {
    name: MyCategoryName,
    y: MyDataPointValue,
    color: MyDataPointColor
   };
   ChartCategories.push( NewCategory );
  }
  else
  {
   //category exists, so just add value to the total
   ExistingCategory[0].y += MyDataPointValue;
   MyDataPointColor = ExistingCategory[0].color;
  }

  //create the data point
  var brightness = (ExistingCategory.length * 0.1) + 0.1;
  var NewDataPoint = {
   name: MyDataPointName,
   y: MyDataPointValue,
   color: Highcharts.Color(MyDataPointColor).brighten(brightness).get()
  };
  ChartValues.push( NewDataPoint );

 });

 /**************************************************
  *** Replace SiSense chart with Highchart ***
  *** container        ***
  *************************************************/

 //get object id of current indicator
 var ObjectID = sender.oid;

 //get the current widget
 var MyWidget = $('widget[widgetid=' + ObjectID + ']');
 if (MyWidget.length == 0)
 {
  MyWidget = $('.widget-body');
 }

 // get the height and width
 var MyChart = MyWidget.find("svg");
 var MyChartWidth = MyChart.attr("width");
 var MyChartHeight = MyChart.attr("height");

 //set the widget's div id and clear all children
 var ChartDiv=document.createElement('div');
 ChartDiv.setAttribute("id",ChartDivName);
 ChartDiv.setAttribute("style","width: " + MyChartWidth + "px; height: " + MyChartHeight + "px; margin: 0 auto");
 MyChart.after(ChartDiv);
 MyChart = $("#" + ChartDivName);
 MyWidget.find("svg").remove();

 /**************************************************
  *** Create the  Highchart within the   ***
  *** Highcharts div container    ***
  *************************************************/

 // Create the chart
    $('#' + ChartDivName).highcharts({
        chart: {
            type: 'pie'
        },
        title: {
            text: ChartTitle
        },
        yAxis: {
            title: {
                text: 'title'
            }
        },
        plotOptions: {
            pie: {
                shadow: false,
                center: ['50%', '50%']
            }
        },
        tooltip: {
   valueDecimals: 0,
            valuePrefix: '$'
        },
        series: [{
            name: ChartLevel1,
            data: ChartCategories,
            size: '60%',
            dataLabels: {
                formatter: function () {
                    return this.y > 5 ? this.point.name : null;
                },
                color: 'white',
                distance: -30
            }
        }, {
            name: ChartLevel2,
            data: ChartValues,
            size: '80%',
            innerSize: '60%',
            dataLabels: {
                formatter: function () {
                    // display only if larger than 1
                    return this.y > 1 ? '<b>' + this.point.name + ':</b> $' + Highcharts.numberFormat(this.point.y,0)  : null;
                }
            }
        }]
    });

 console.log('custom code finished.');
})
Updated 02-09-2024
intapiuser
Admin
Joined December 15, 2022