Maximize Dashboard Performance
What is good dashboard performance?
Dashboard performance is the time it takes to load a Sisense dashboard. We want our users to have a good experience when working with our data. The time taken to load the dashboard is the first step.
Each individual widget in a dashboard is a separate query. The dashboard needs to send these queries through the Microsoft IIS web server to the ElastiCube, pull back the results and populate the data visualizations. The questions we will address in this post are what is a reasonable dashboard load time and how can we enhance performance.
So, what is good dashboard performance? This is a slightly subjective question. Users always want the fastest load time. However, we must think about load time relative to the data we are processing. If the dashboard is aggregating billions of rows of data, it is unrealistic to expect two-second load times. The converse is true as well — if a dashboard is based on a few thousand rows of data, the dashboard should not take five minutes to load. The goal, to put it simply, is to optimize the load time relative to the amount of data the dashboard is processing. Sisense’s architecture is designed to return queries very quickly, and there are ways to help it.
How to monitor performance
Timing
First and foremost, how long does the dashboard take to load after the user navigates to the URL? Does the load time inhibit the user experience? As discussed before, the answer will vary by the use case, ElastiCube size, and end user. However, as a general guideline we want the load time to be under a minute if the dashboard is not crunching enormous amounts of data.
System Resources
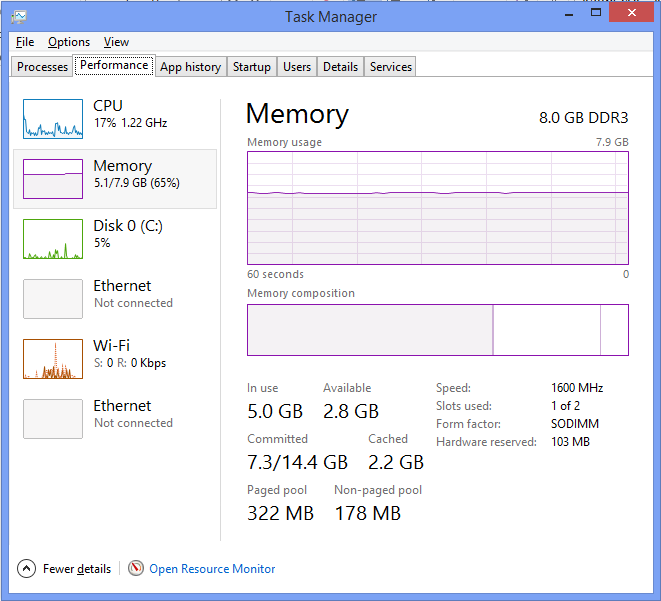
Monitoring system resources during dashboard load is the first step to identifying possible issues. These can be monitored live by opening the Task Manager > Performance tab. RAM and CPU should not be maxed out during the dashboard load. If they are, it could be hindering the process. More system resources might be necessary (see here for Sisense's minimum hardware guidelines).
Components
ElastiCube.exe – if this process is taking CPU and RAM then the query is too heavy. This could be a possible many to many occurrence (covered below)
ElastiCubeManagement Service – if this process is taking CPU and RAM, you most likely have a build occurring at the same time
Java(TM) Platform SE Binary - This process transmits Sisense monitoring data. Heavy use of hardware is expected when restarting the service after a while (as it catches up on transmitting data), but if you experience continued consumption, confirm you are using the latest version of the Sisense Monitor
Node.js - If this process is heavily consuming resources, check whether you have recently published dashboards to a large number of users.
w3wp / iisexpress – if this process is taking CPU and RAM you may be overloading your IIS server. This is mostly likely when presenting too much data (covered below)
Another way of monitoring system resources is by using the Windows Performance monitor. This will help analyze system resources over time. The post here should help: https://learn.microsoft.com/en-us/windows-server/identity/ad-fs/deployment/configure-performance-monitoring
Timing vs other dashboards
Using other dashboards that use similar data sets as a baseline can also be useful. For example, two dashboards are using the same ElastiCube. Dashboard-A takes 30 seconds to load. Dashboard-B takes five minutes. Knowing that Dashboard-A loads normally, we can tell that Dashboard B has some kind of an issue. Possible issues could be a bad join, many-to-many relationship, or specific troublesome widget that Dashboard A did not have. Compare the differences to narrow down possible issues.
Web Developer Console
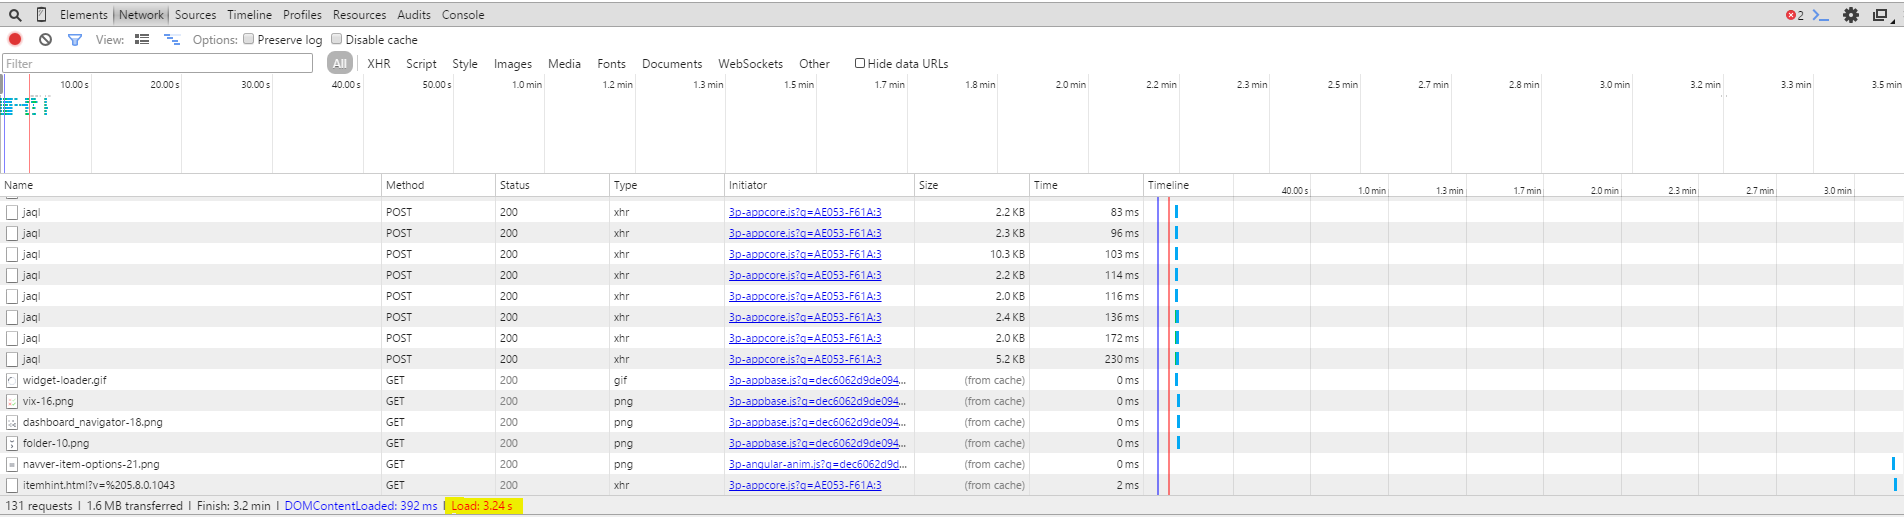
Developer Tools within your web browser allow us to track each dashboard component's load time. In Chrome before loading the dashboard, open the developer console (F12 in Chrome). Navigate to the Network tab. From there you can see the timeline and the long-running requests. Most likely it will be the JAQL queries that take the longest. You can then click those records for more information.
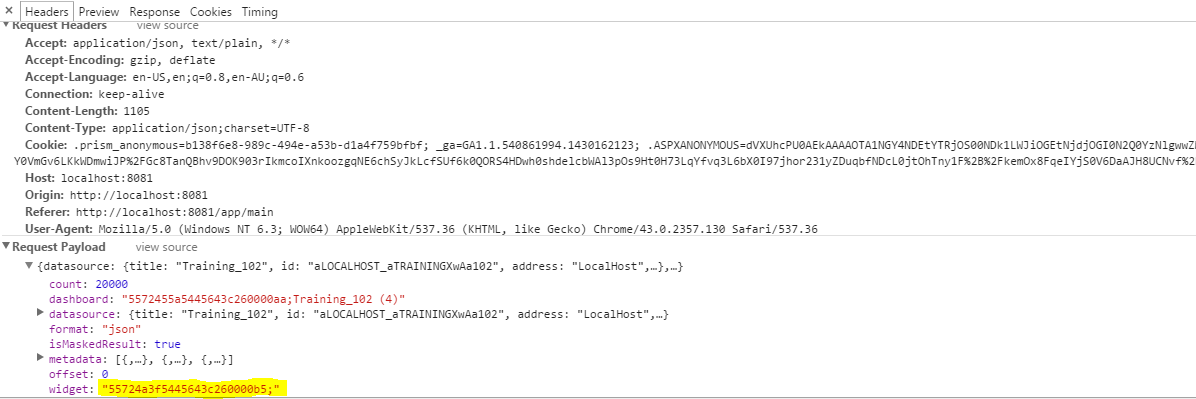
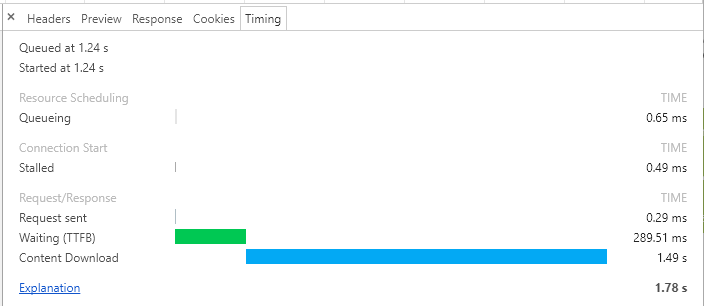
Under Headers>Request Payload there is information about the widget ID and Name. This will help identify the long-running queries. Under Timing, you can view what composed the query response time. Stalled represents one query waiting for other queries to finish (there is a limit to the number of concurrent queries your web browser can run). Waiting (TTFB) represents time waiting for the ElastiCube to respond. Content Download represents the amount of time retrieving the query results.
If the JAQL queries are not the longest running components, you may have connectivity issues to your server, or are using too much Javascript (covered below).
Causes of slowness
System Resources
A reasonable query time depends on a few factors. First and foremost, system resources. The recommended system resources for Sisense can be found here: https://docs.sisense.com/win/SisenseWin/windows-minimum-requirements.htm.
Amount of data
The amount of data crunched/returned in a query has an impact on performance. Logically, this makes sense. Crunching one million rows will, of course, return faster than one billion rows. The way to affect this is by adjusting filters to limit the data returned. Furthermore, limiting the amount of data in the ElastiCube is useful. This can be done by editing either the tables that Sisense is connected to, or by editing the SQL statement that is used to query the original data source.
Schema Design
Schema design is a very important factor in query performance. Each data connection within the ElastiCube will become an inner join when the dashboard queries this data. Joins are costly when it comes to query time. When designing the schema for performance, the ElastiCube designer should de-normalize the schema as much as possible. De-normalization means having a fewer amount of joins, and including redundant information in one table. For more on schema de-normalization, see here.
Custom Calculations in the Dashboard
Custom calculations are often useful when manipulating data to answer business questions. They allow users to aggregate data in various ways to present visually. However, they do take time to process. Each custom calculation is a separate query that is processed by Sisense. To enhance query performance we can cut down the number of queries generated by the dashboard. This is done by moving some calculations to the ElastiCube, thus moving that process time to the build time instead of dashboard load. The best example is a row calculation, such as the addition of two separate columns — FieldA + Field B. This type of calculation can be easily added to a table using the same exact formula as a custom field. If it is from a different table, we can use the LOOKUP function in the ElastiCube Manager.
Presenting too much data
Presenting large amounts of data is costly on dashboard load time as well. More specifically this causes slowness when using a pivot or table widget with many rows. The web server has to process the large amount of data and store it to allow the tool to present it visually. If it is possible, limit the number of dimensions that break the data to such a granular form.
Sisense generally recommends 6-8 widgets per dashboard for optimal performance. Each widget incurs incremental query and rendering time. Sisense's official add-ons such as Accordion, Jump to Dashboard, and Switchable Dimensions may be leveraged to reduce the number of widgets while preserving the amount of data accessible to end users.
When an end user loads the first dashboard in a session, performance will be slower against subsequent dashboard loads, as common web application elements such as logos, toolbars, and code templates are loaded for the first time. Later navigation between dashboards once these resources are cached will be faster.
Other causes of query slowness and slow dashboard performance
Many to Many
If RAM grows exponentially, and the dashboard takes a very long time to load, you could have a possible many to many relationship. A many to many relationship (M2M) can cause extreme slowness in dashboard load time. A M2M is a relationship in the ElastiCube where neither side of the relationship is unique. This creates a Cartesian product, thus consuming all of the machine's resources.
Relationship Cycle
A relationship cycle exists when there are multiple join paths between two tables in a data model. Sisense will generally opt for the shortest path, but depending on the dimensions used (in widgets or filters), Sisense can take join paths through tables that are unexpected to dashboard designers. While not as deleterious to performance, an additional join on a large table can reduce performance and possibly lead to unexpected results. For more information on relationship cycles in data modeling, please visit the Handling Relationship Cycles documentation page.
For the detection of data model issues such as many-to-many relationships and cycles, we recommend using the official Visualize Queries plugin.
Data Security
If some users are seeing slow performance but others are not, it is worthwhile to check the data security of the user in question. Some questions to consider:
- Are there complex queries occurring on the ElastiCube due to competing data security settings?
- Does the data brought in by data security cause pivot tables or other widgets to display a larger amount of data than expected?
Please reference the official documentation on data security here.
Browser Compatibility
If some users are seeing slower dashboard performance on certain machines or browsers, check to make sure they are using a support browser outlined in the Minimum Requirements and Supported Platforms document.
Updated 02-23-2024
intapiuser
Admin
Joined December 15, 2022