Custom Widget Script Styling Not Coming Through on sdk-ui Chart Component
I have a widget where I have edited the script to apply custom formatting (changing the “time” from being displayed in seconds => to minutes & seconds). However, when I display this widget in my React project with the <LineChart {...widget.getChartProps()}/> component from sdk-ui, the custom formatting is not showing up. Is there something special I need to do here to be able to see this custom script styling in the sdk-ui component? I’m not finding any community posts describing this problem or a solution.
Hi ewoytowitz
Alright, thanks for providing the example. Here is a Compose SDK version of the same, using `onBeforeRender` prop.
import { Chart, ChartProps, useGetWidgetModel } from "@sisense/sdk-ui";
import { useState } from "react";

function CodeExample() {

  const { widget } = useGetWidgetModel({
    dashboardOid: '<your_dashboard_id>',
    widgetOid: '<your_widget_id>',
  });

  const [chartProps, setChartProps] = useState<ChartProps>();

  if (widget && !chartProps) setChartProps(widget.getChartProps());

  function convertRawTime(seconds: string) {
    var totalSeconds = parseFloat(seconds); // Ensure we're working with a number, maintaining decimals
    var sign = totalSeconds < 0 ? '-' : '';
    var absTotalSeconds = Math.abs(totalSeconds);
    var minutes = Math.floor(absTotalSeconds / 60);
    var preciseSeconds = (absTotalSeconds % 60).toFixed(2); // Keeps two decimal places for seconds
    var formattedTime = (minutes < 10 ? minutes : minutes) + ":" +
      (parseInt(preciseSeconds) < 10 ? "0" + preciseSeconds : preciseSeconds);
    return sign + formattedTime;
  }

  return (
    <>
      {chartProps &&
        <Chart
          chartType={chartProps.chartType}
          dataSet={chartProps.dataSet}
          dataOptions={chartProps.dataOptions}
          filters={chartProps.filters}
          highlights={chartProps.highlights}
          styleOptions={chartProps.styleOptions}
          onBeforeRender={(options: any) => {
            options.series.forEach(function (series: any) {
              series.dataLabels = {
                enabled: true,
                borderRadius: 5,
                backgroundColor: 'rgba(250, 250, 250, 0.7)',
                formatter: function () {
                  // Assuming 'y' holds the time in seconds with milliseconds
                  return convertRawTime(this.y);
                }
              };
            })
            return options;
          }}
        />
      }
    </>
  );
};

export default CodeExample;
Hope it helps!
Steve
Hi ewoytowitz
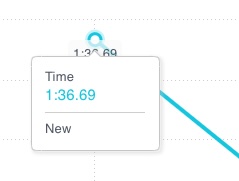
You can customise the tooltip using the same convertRawTime function, however by modifying the tooltip formatter function, you lose the Sisense style tooltips and will revert to highcharts default tooltips.
To avoid losing that style, I manually recreated the same tooltip structure that Sisense generates, but added the customRawTime function in there too, so this should solve your question.
You can add this to the onBeforeRender handler right before the return options; line
options.tooltip = {
              ...options.tooltip,
              formatter: function () {
                console.log(this);
                return '<div style="min-width: 100px; color: rgb(91, 99, 114); font-size: 13px; line-height: 18px; margin: 4px 6px;">'
                + this.series.name + '<br/>'
                + `<span style="font-size: 15px; line-height: 18px; color: ${this.point.color}">` + convertRawTime(this.y) + '</span>'
                + '<hr class="csdk-border-t" style="margin: 7px 0px;">'
                + this.x
                + '</div>';
              }
            };
Please note some other types / configurations of charts might have different tooltip contents (e.g .stacked charts) so this function would need adapting in those cases.
Thanks
Steve