Dictate Color Of A Scatter Chart Point With Value In The Data
Summary: intapiuser inquired about how to set the color of a scatter chart point based on a value in the data.
Introduction
Many datasets carry a color description for each item - for example a product color such as red or a hex value such as #D7F77D. This widget script reads that color column and paints each scatter point with its own color, instead of the default palette coloring. Both hex values (#000000) and CSS color names (red) are supported. Values the browser doesn't recognize fall back to the chart's default color.
Implementation
1. Create the scatter chart you'd like to put this logic in
2. In the widget editor screen, click the three bar menu at the top right, and then click 'Edit Script'.
3. Copy the contents of the script thats attached to this post, ScatterChart-CustomColors.js, into the widget editor screen.
4. Click save, then refresh the widget.
Supported values: Hex (#000000) and CSS color names (red). Values the browser doesn't recognize (e.g. N/A, Silver/Black) render as black. Rows with no color value fall back to white - clean the color values in the ElastiCube if you need guaranteed, consistent coloring.
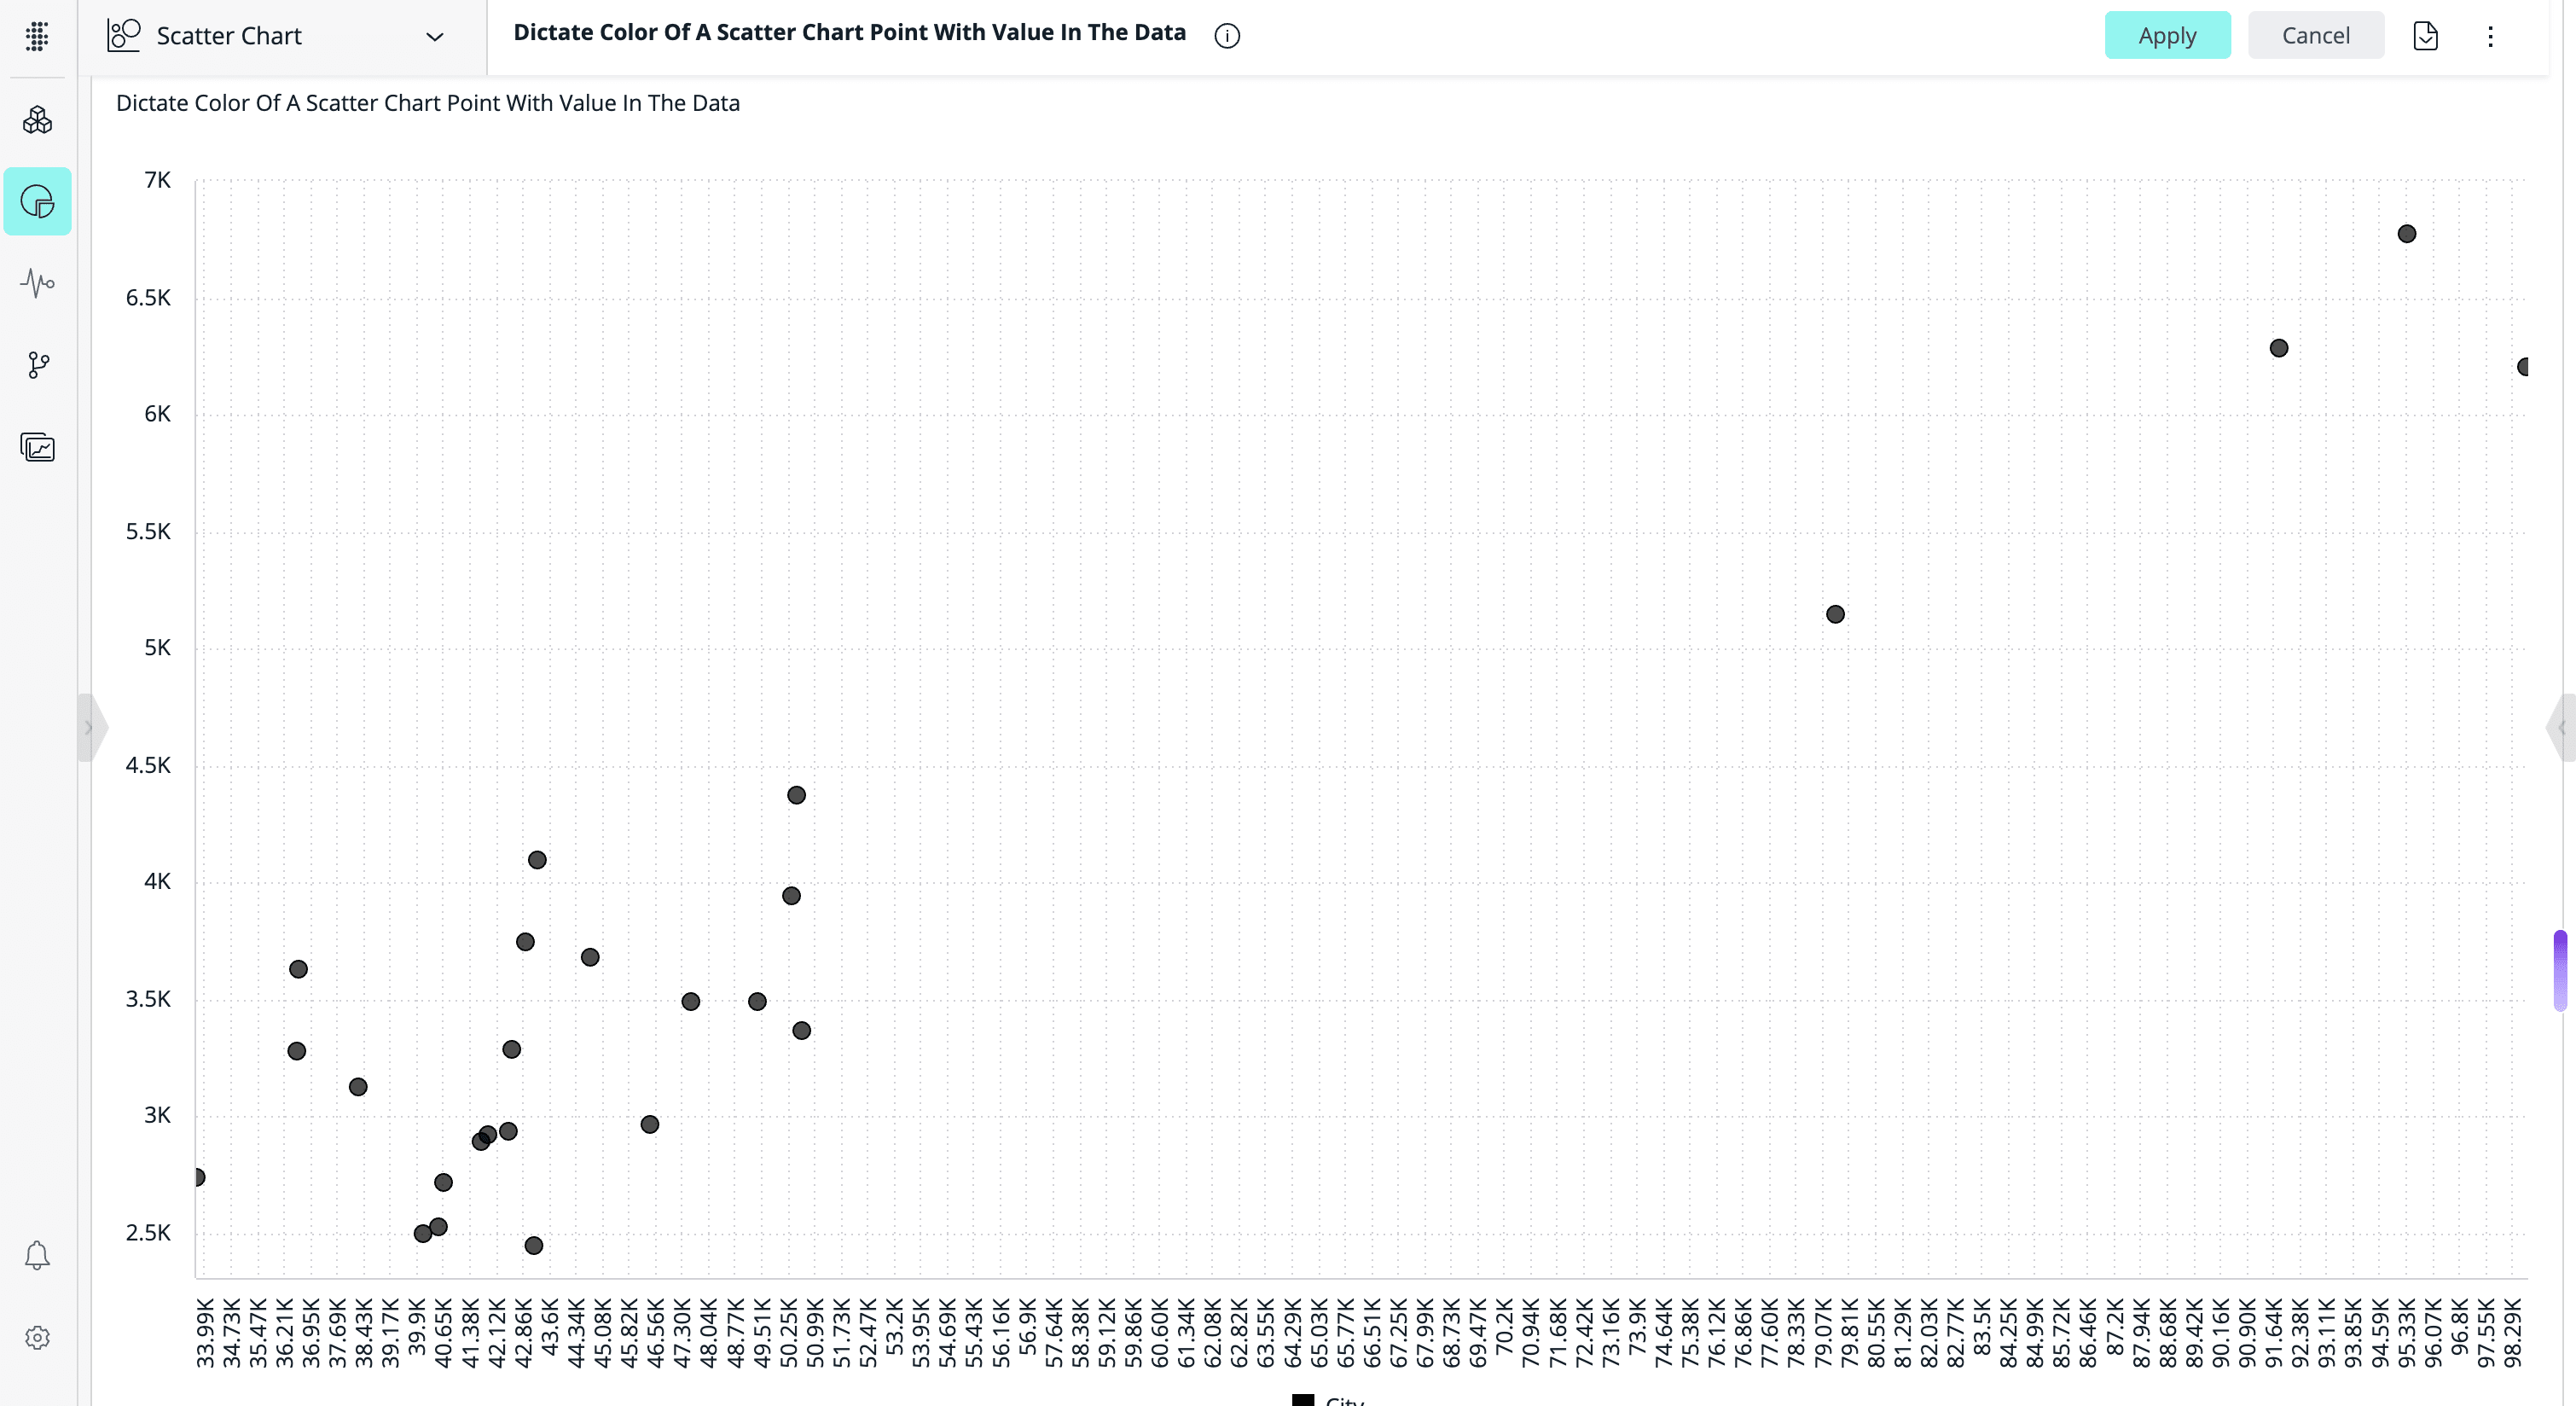
In this example, I used the hexadecimal color values om the break by. #000000 corresponds to the color black, so data in that group gets displayed as black.
Using Text, Rather Than Hexadecimal Values
In addition to hexadecimal values, plain text color values can be used with this script.
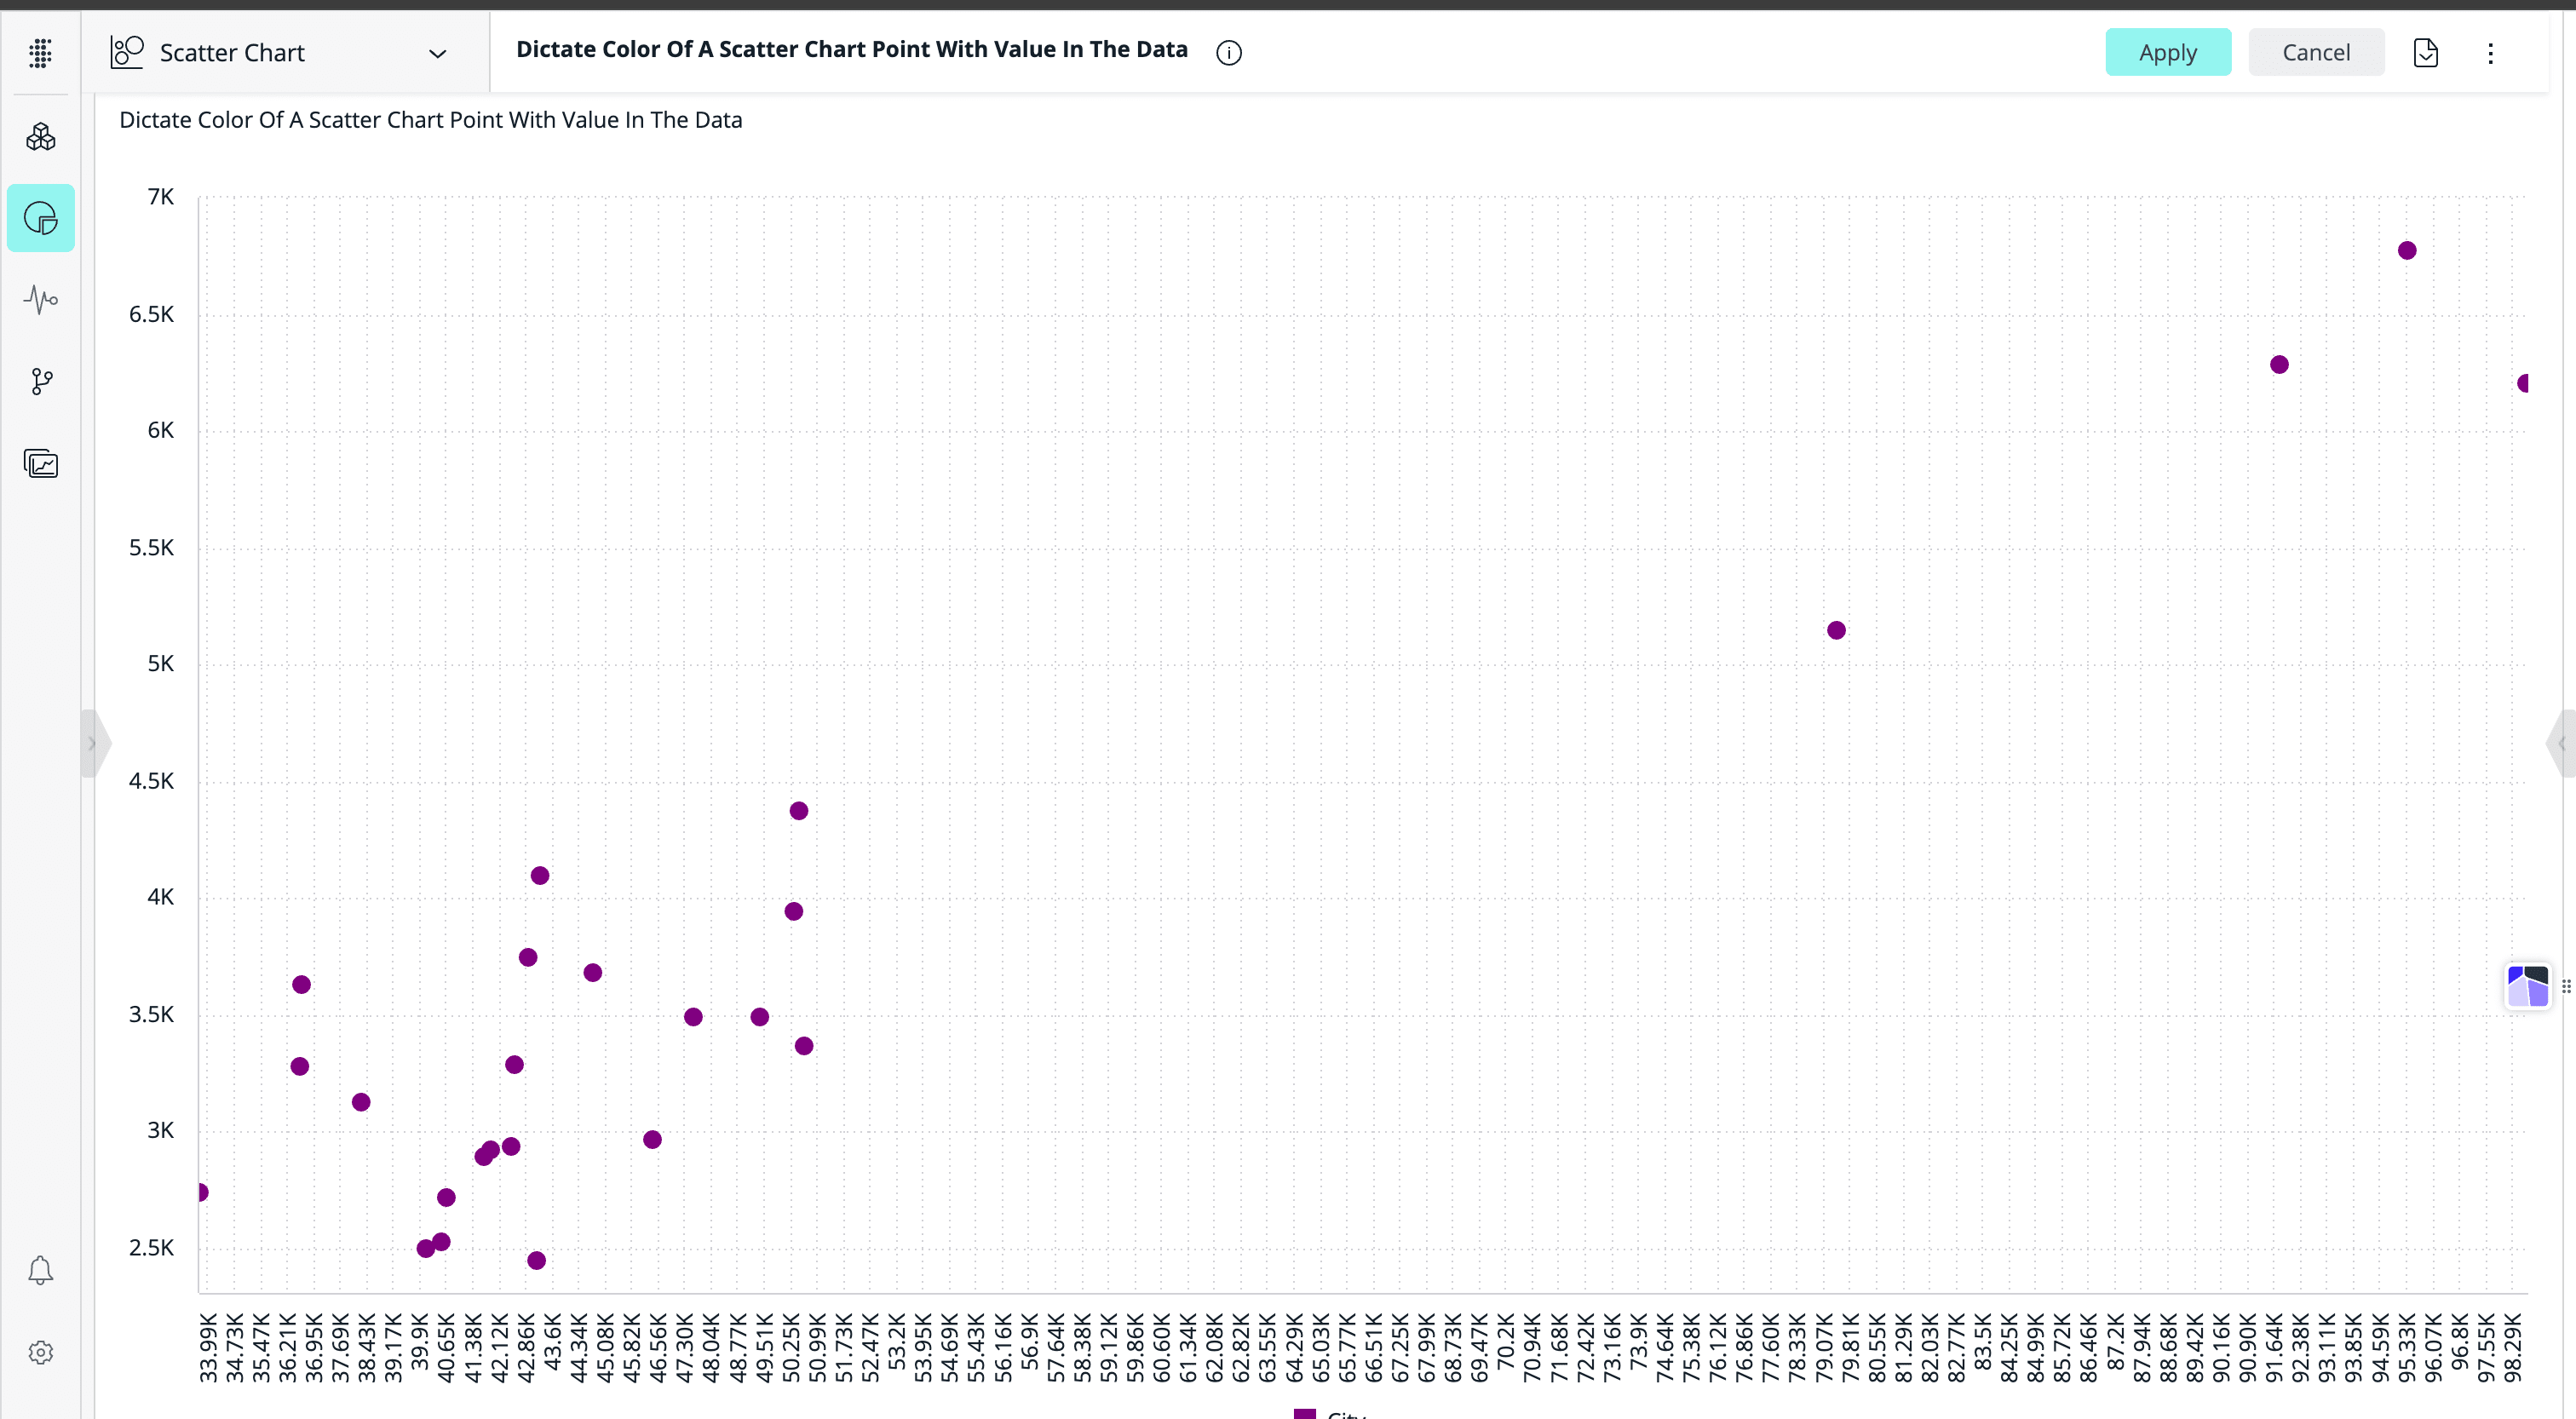
In this example, you can see that the valid color values get displayed correctly. However, invalid color values, such as N\A and Silver/Black, are displayed as black.
Script:
/*
Welcome to your Widget's Script.
 - You can access your Widget via the 'widget' variable name.
 - You can access your Widget's DOM via the 'element' variable name (undefined until DOM creation).
 - You can access your Dashboard by accessing the 'dashboard' variable name.
 - For a complete API reference for Widgets and Dashboards go here: https://docs.google.com/document/d/1nQBZtWAdNFAd9nBhPWGVT3qOMS4Qm0PzBZVIzz5DfE8/
*/

widget.on('processresult', function(widget,result){

 // Get all the data points
 var dataSeries = result.result.series;

 // Loop through each data point
 $.each(dataSeries, function(){

  var color = "purple";

  // Loop through all data points
  $.each(this.data, function(){

   // Look for the color series
   if (this.selectionData[3]) {
    color = this.selectionData[3];
   }

   // Set the color for this point
   this.color = color;
  })

  // Set the color for the bubble
  this.color = color;
 })
})
