Place Data Labels Below the Mark on a Scatter Chart
Summary: mbhg8c describes a script to reposition data labels on a Scatter chart in Sisense by adjusting the vertical alignment and y-offset to place labels below the marks instead of overlapping them. The script is intended for use in the Edit Script tab of the widget and has been validated on version 2026.2.2. Users are advised to test the script in their environment, as it may not work in all scenarios or Sisense versions.
By default, data labels on a Scatter chart overlap the dot directly.
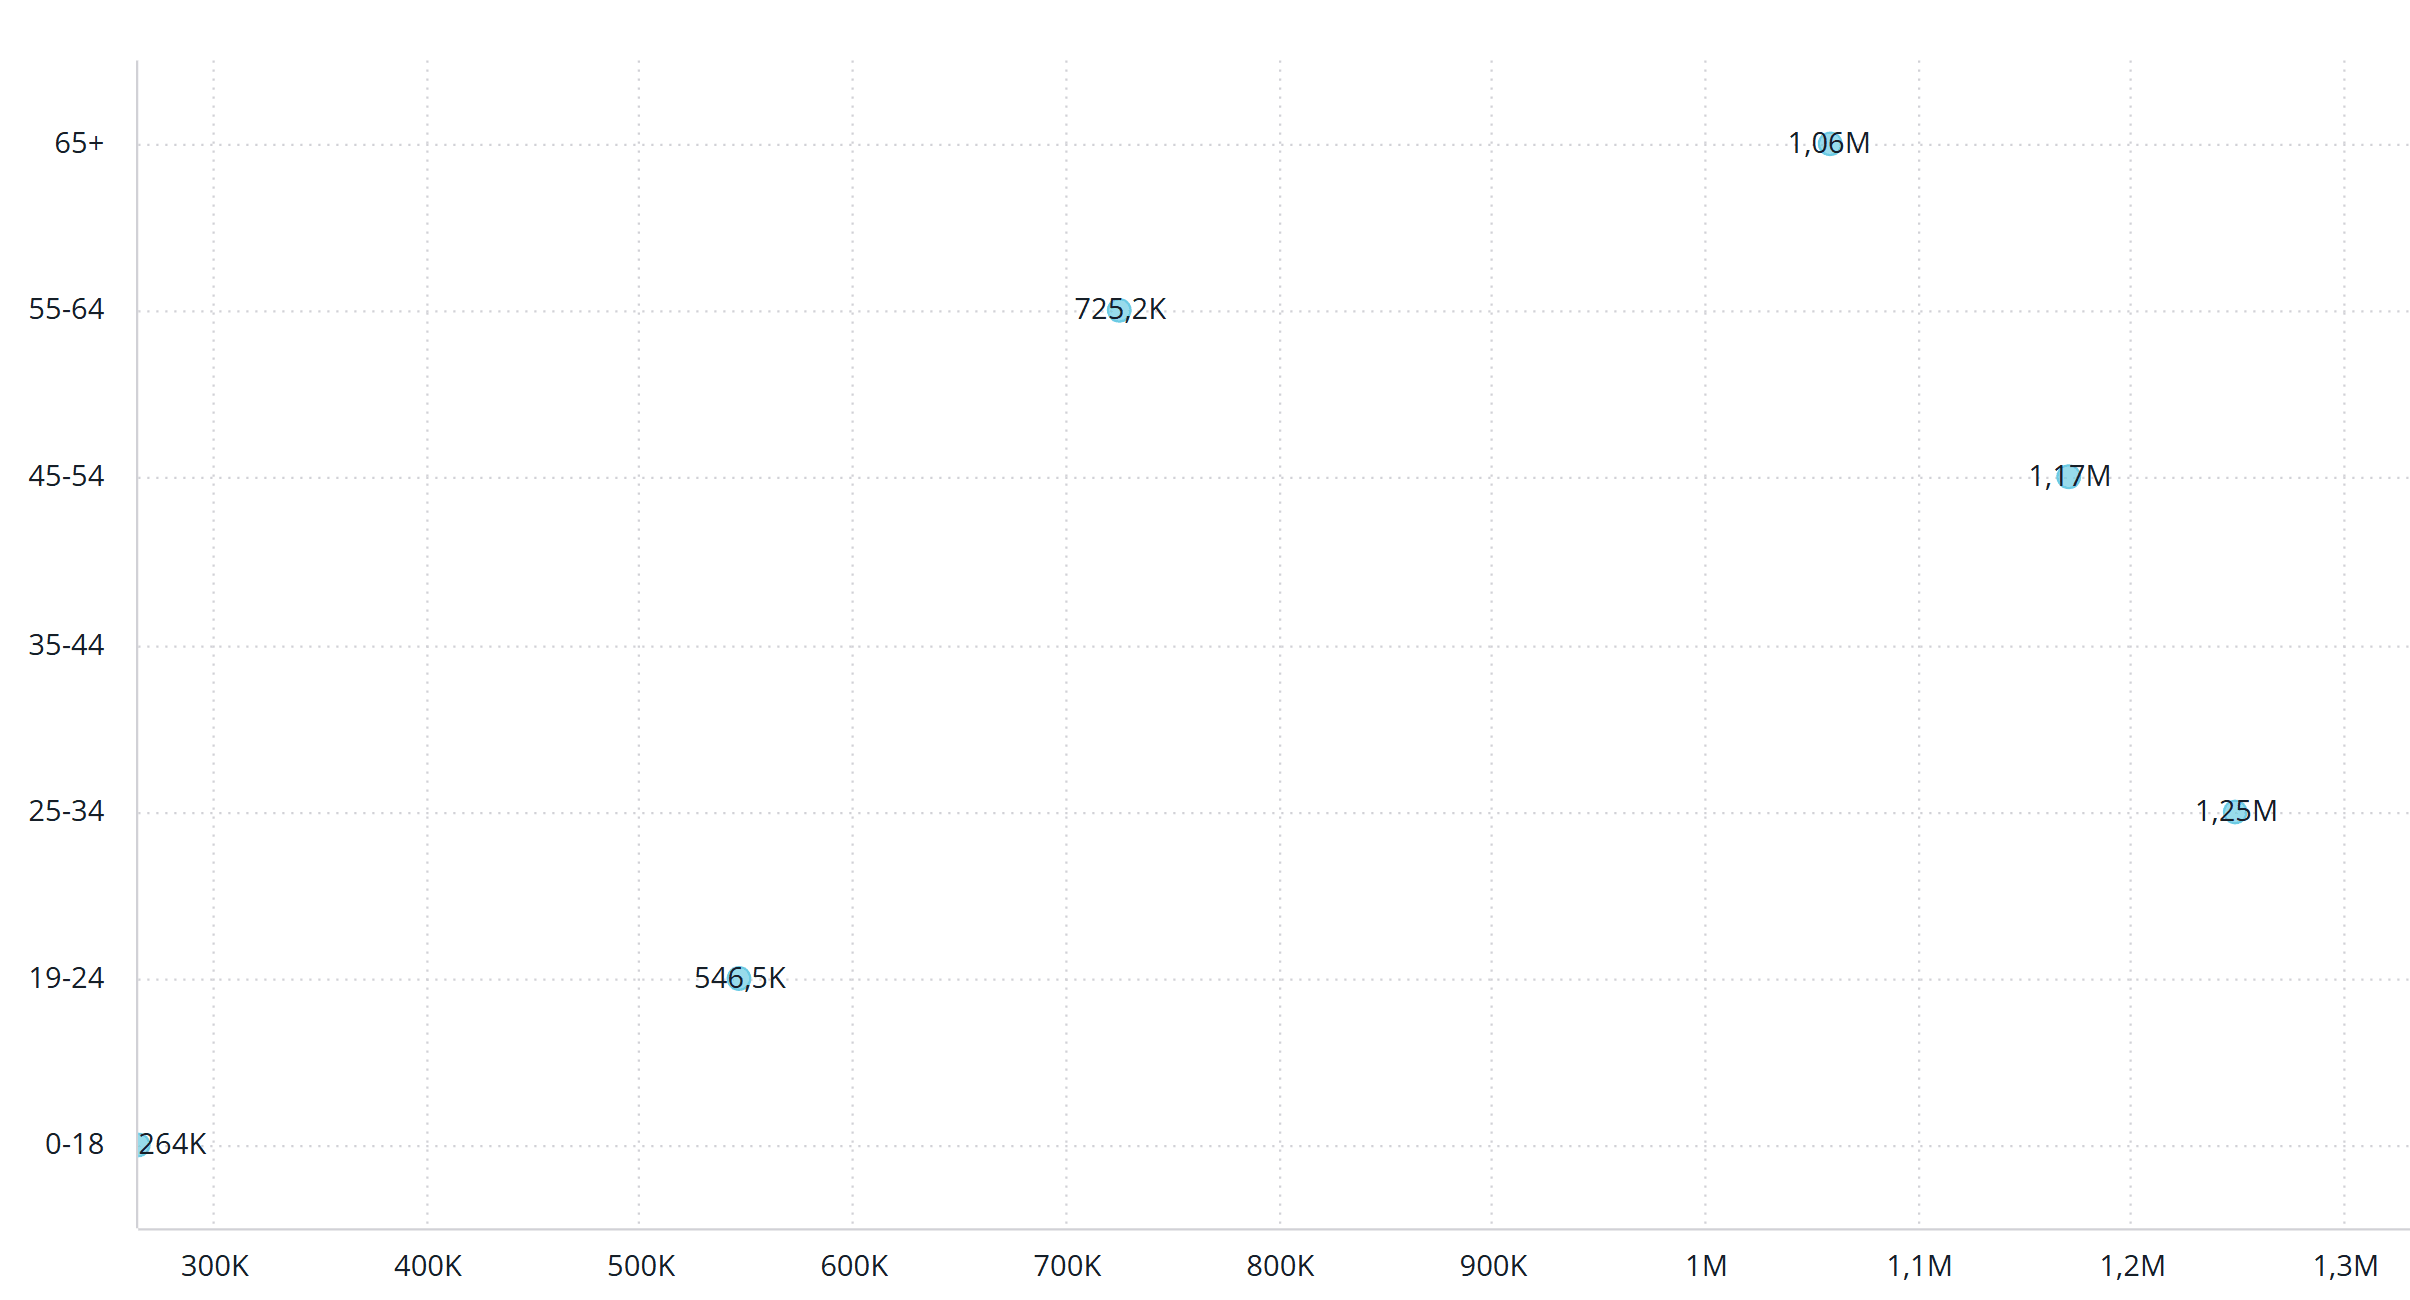
The script below repositions each label to sit cleanly beneath its mark:
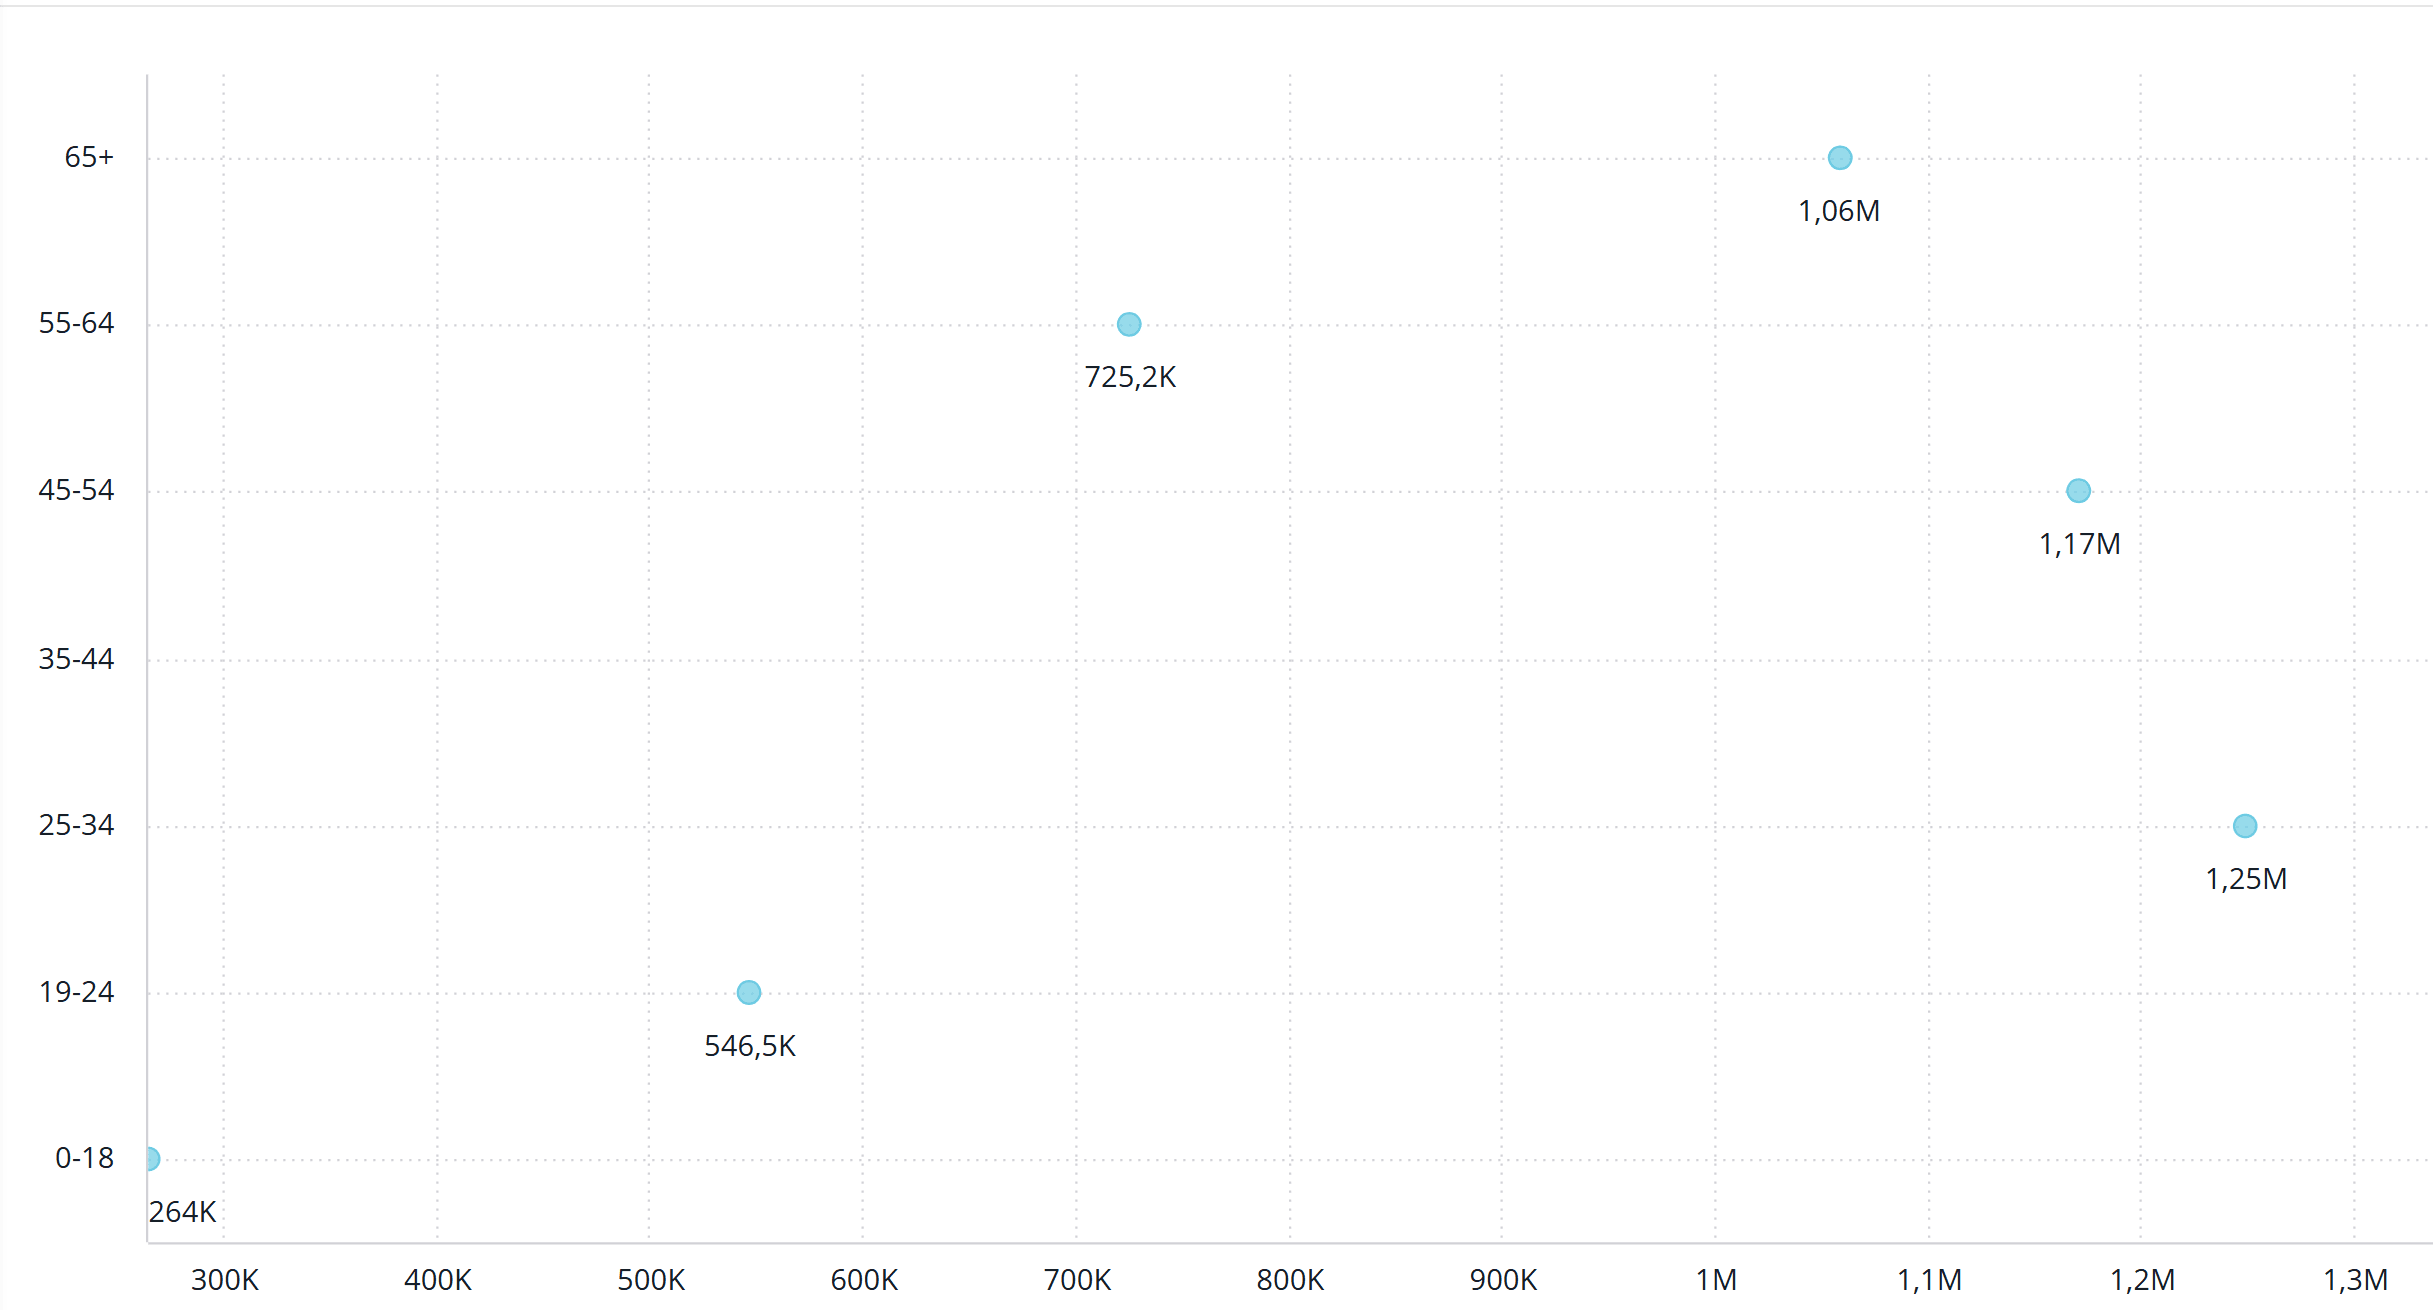
Open the widget in Edit mode, go to the Edit Script tab, and paste:Open the widget in Edit mode, go to the Script tab, and paste:
widget.on('processresult', function(se, ev) {
    ev.result.series.forEach(function(series) {
        series.dataLabels = {
            enabled: true,
            y: 15,
            verticalAlign: 'top',
            allowOverlap: true
        };
    });
});
The key is pairing verticalAlign: 'top' with a positive y offset — anchoring to the top of the dot and nudging downward places the label below it rather than on top. Increase y for a larger gap, decrease it to bring the label closer.The key is pairing verticalAlign: 'top' with a positive y offset — anchoring to the top of the dot and nudging downward places the label below it rather than on top. Increase y for a larger gap, decrease it to bring the label closer.
The script was valided on version 2026.2.2.
Disclaimer: This post outlines a potential custom workaround for a specific use case or provides instructions regarding a specific task. The solution may not work in all scenarios or Sisense versions, so we strongly recommend testing it in your environment before deployment. If you need further assistance with this, please let us know.

